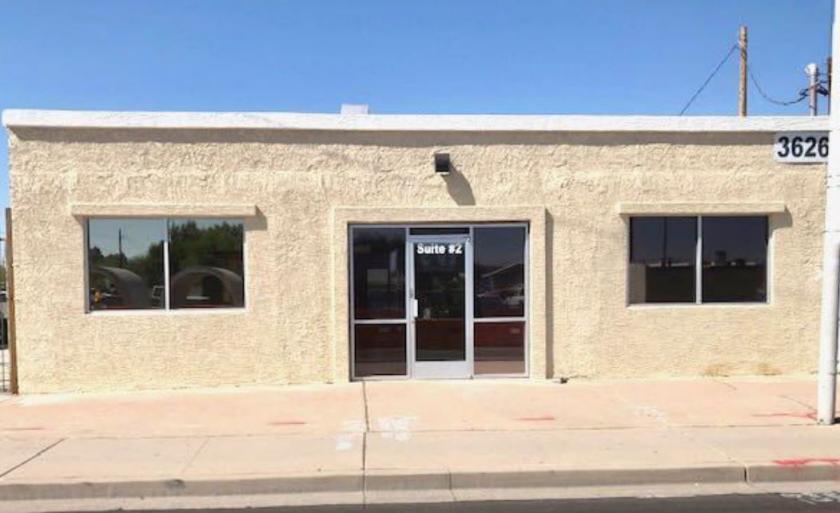
Office Space
3626 South Central Avenue Phoenix, AZ 85040
3626 South Central Avenue Phoenix, AZ 85040
Details & Description
Property Highlights
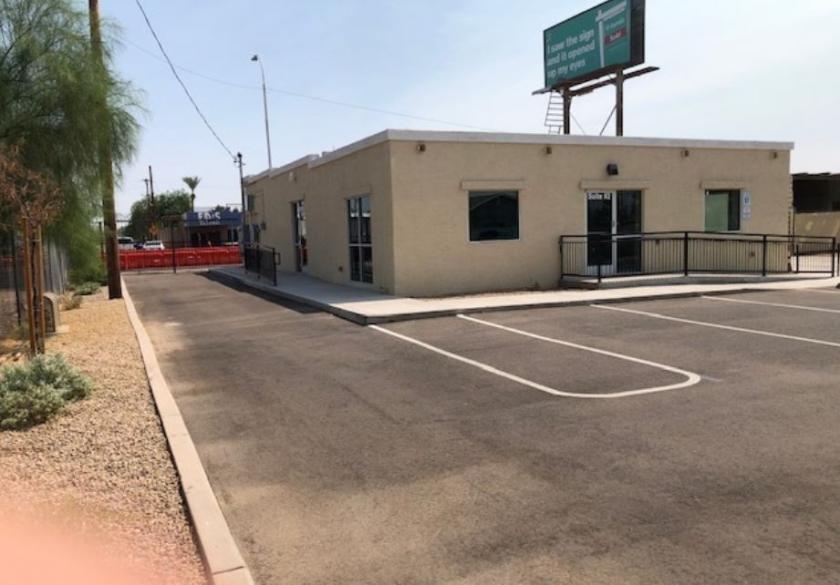
- • Hard corner
- • Easy access to I-17
- • Close to Downtown Phoenix
- • Opportunity Zone
- • Airport 4.7 miles away - 12 minutes
- • Light Rail being installed on Central Ave
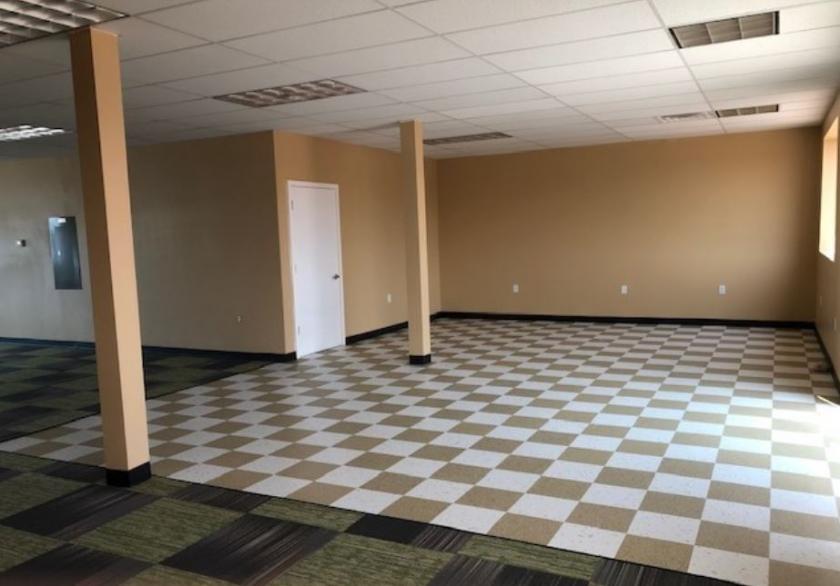
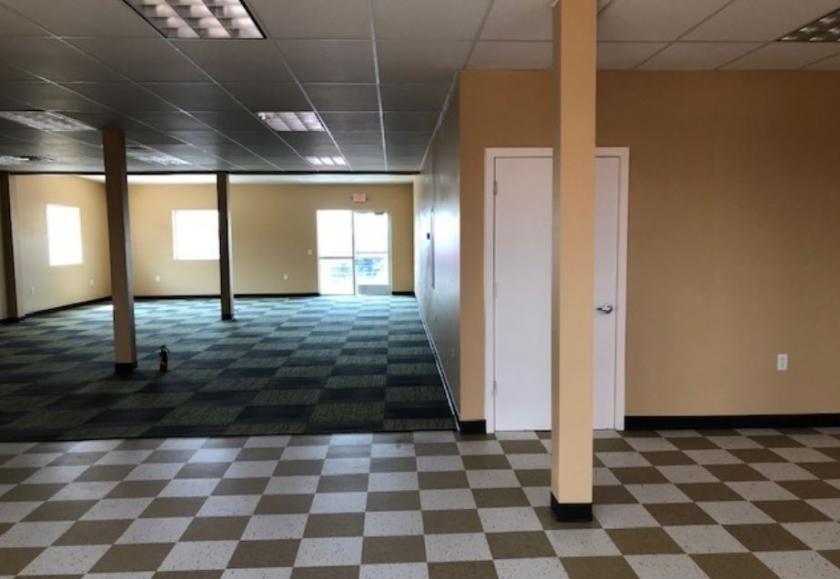
Additional Photos
Listing Agents

Bill Nanney
KW Commercial
O: 480-759-4300
M: 480-686-1440
wjnanney@cox.net
KW Commercial
O: 480-759-4300
M: 480-686-1440
wjnanney@cox.net
While we strive to provide the most accurate information, all listing information, and demographic data, is provided by third-parties. As such, MyEListing will not be responsible for the accuracy of the information. It is strongly recommended that you verify all information with the listing agent, and any relevant agencies, prior to making any decisions.


