Commercial Land
7300 West Van Buren Street Phoenix, AZ 85043
7300 West Van Buren Street Phoenix, AZ 85043
Details & Description
Property Highlights
- • Perfect Truck Terminal
- • Auto repair and Salvage
- • $4,400 built-in monthly revenue with present setup
- • Convert to Outdoorindoor storage units
- • RV parking
- • Zoning is suitable for most any business
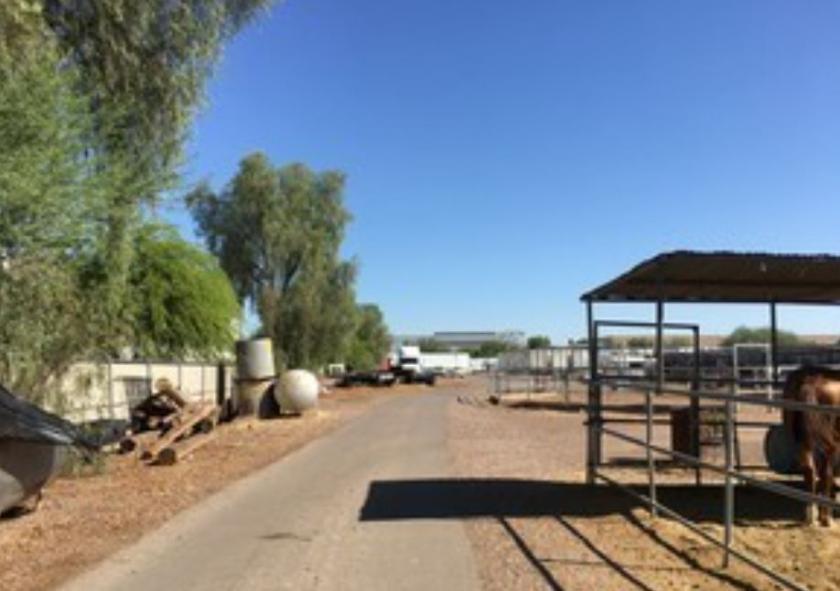
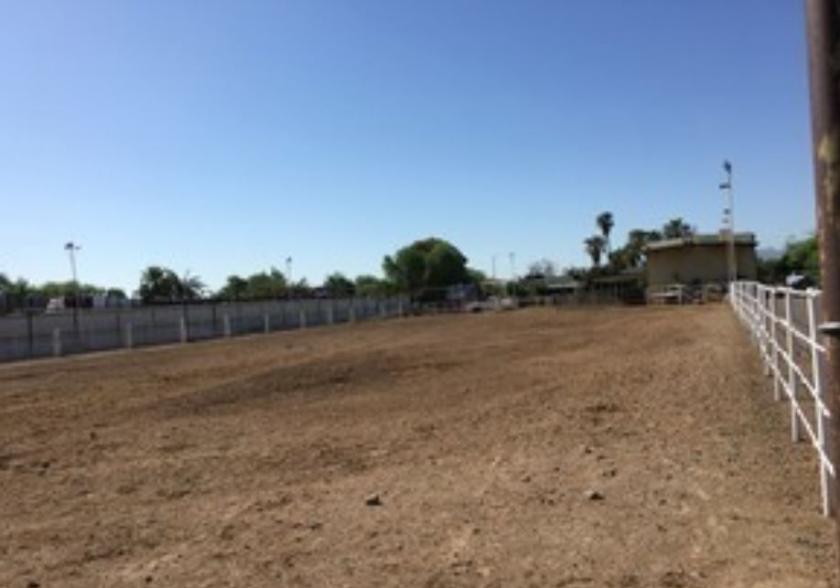
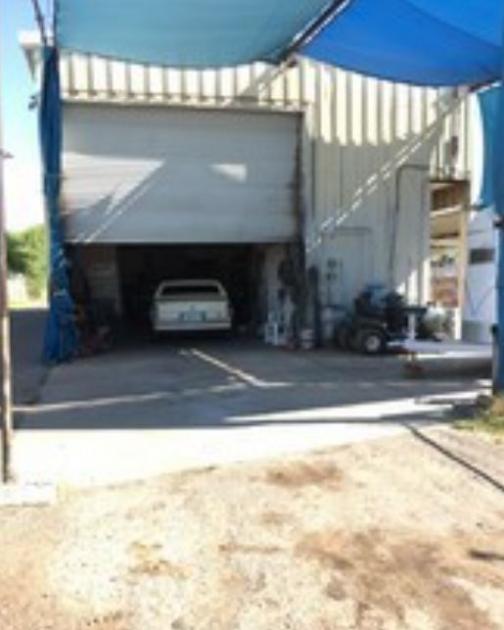
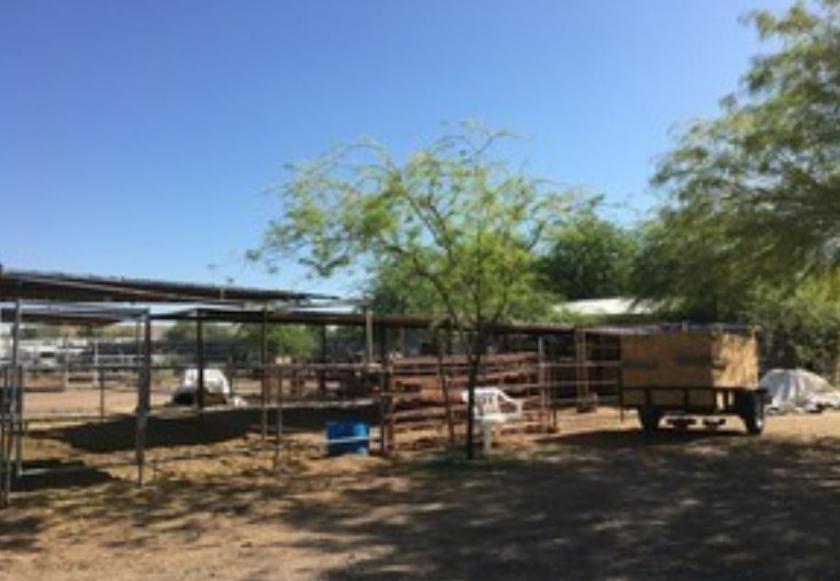
Additional Photos
Listing Agents

Bill Nanney
KW Commercial
O: 480-759-4300
M: 480-686-1440
wjnanney@cox.net
KW Commercial
O: 480-759-4300
M: 480-686-1440
wjnanney@cox.net
While we strive to provide the most accurate information, all listing information, and demographic data, is provided by third-parties. As such, MyEListing will not be responsible for the accuracy of the information. It is strongly recommended that you verify all information with the listing agent, and any relevant agencies, prior to making any decisions.


