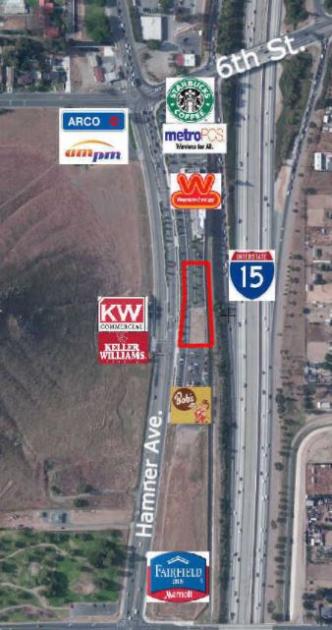
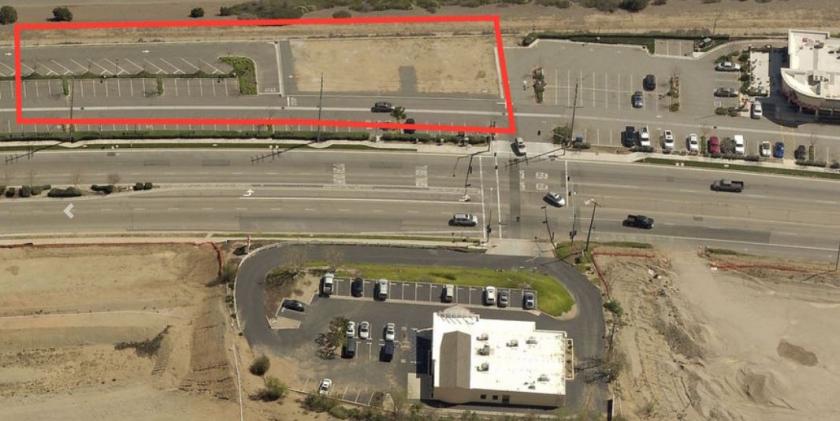
1-Mile | 3-Miles | 5-Miles | ||
---|---|---|---|---|
Total Population | 7,857 | 89,980 | 260,380 | |
Population Median Age | 39 | 35 | 35 | |
Population by Age | 0-9 Yrs | 739 (9%) | 12458 (13%) | 37030 (14%) |
10-19 Yrs | 896 (11%) | 13559 (15%) | 39083 (15%) | |
20-29 Yrs | 1041 (13%) | 12380 (13%) | 40061 (15%) | |
30-39 Yrs | 1289 (16%) | 13123 (14%) | 39406 (15%) | |
40-49 Yrs | 1272 (16%) | 13552 (15%) | 36724 (14%) | |
50-59 Yrs | 1212 (15%) | 11898 (13%) | 32026 (12%) | |
60-69 Yrs | 743 (9%) | 7156 (7%) | 19980 (7%) | |
70+ Yrs | 666 (8%) | 5855 (6%) | 16070 (6%) | |
Median HH Income | $98,315 | $109,894 | $81,253 | |
Total Household Income | < 24K | 236 (11%) | 1952 (8%) | 8366 (12%) |
25-49K | 260 (12%) | 2682 (12%) | 11866 (17%) | |
50-74K | 296 (14%) | 2732 (12%) | 11283 (16%) | |
75-99K | 238 (11%) | 2640 (11%) | 9202 (13%) | |
100-199K | 793 (39%) | 8895 (39%) | 20836 (30%) | |
200K+ | 205 (10%) | 3405 (15%) | 6081 (8%) | |
Highest Education Level | No Diploma | 882 | 7383 | 30762 |
Diploma or GED | 1560 | 13932 | 44429 | |
Some College | 1626 | 14602 | 37847 | |
Assoc. Degree | 481 | 5518 | 13547 | |
Bachelors Degree | 708 | 10958 | 25570 | |
Higher Degree | 439 | 5706 | 12567 | |
Total Housing Units | 2,111 | 23,210 | 70,931 | |
--Owner-Occupied | 1,644 | 17,242 | 43,253 | |
--Renter-Occupied | 384 | 5,064 | 24,381 | |
Owner-Occupied Values | < 100K | 3 | 197 | 2231 |
100-199K | 15 | 103 | 1004 | |
200-299K | 62 | 426 | 3335 | |
300-399K | 252 | 2172 | 9469 | |
400-499K | 572 | 4415 | 11301 | |
500K+ | 740 | 9929 | 15913 | |
Total Working Age Population | 6,536 | 69,144 | 199,403 | |
In Work Force | 3,665 | 44,783 | 129,545 | |
Not In Work Force | 2,871 | 24,361 | 69,857 | |
Workforce Employed | 3,484 | 42,617 | 122,650 | |
Workforce Unemployed | 179 | 2,062 | 6,684 | |
Civlian Workforce | 3,663 | 44,679 | 129,334 | |
Military Workforce | 2 | 104 | 212 | |
Total Households | 2,027 | 22,306 | 67,634 | |
Family Households | 1,550 | 18,543 | 53,945 | |
Non-Family Households | 478 | 3,762 | 13,689 | |
Married Couple | 1,181 | 15,079 | 40,448 | |
Other Family | 369 | 3,464 | 13,497 | |
Married w/Child | 417 | 7,551 | 20,423 | |
Single Male w/Child | 11 | 448 | 1,813 | |
Single Female w/Child | 90 | 1,108 | 4,455 |
Population Change Last Two Decades - Plus Projection
2000 | % | 2010 | % | 2020 | % | 2030 | |
---|---|---|---|---|---|---|---|
California | 33,871,648 | +10 | 37,253,956 | +9 | 40,467,295 | +8 | 43,631,295 |
Orange County | 2,846,289 | +6 | 3,010,232 | +8 | 3,257,087 | +5 | 3,431,096 |
Riverside County | 1,545,387 | +42 | 2,189,641 | +14 | 2,493,116 | +14 | 2,843,493 |
San Bernardino County | 1,709,434 | +19 | 2,035,210 | +9 | 2,223,189 | +11 | 2,468,202 |
Total Working Age Population:
Total Households:
Total Working Age Population:
Total Households:
Total Working Age Population:
Total Households: