Commercial Land
13142 Leopard Street Corpus Christi, TX 78410
13142 Leopard Street Corpus Christi, TX 78410
Details & Description
Property Highlights
- • High Traffic
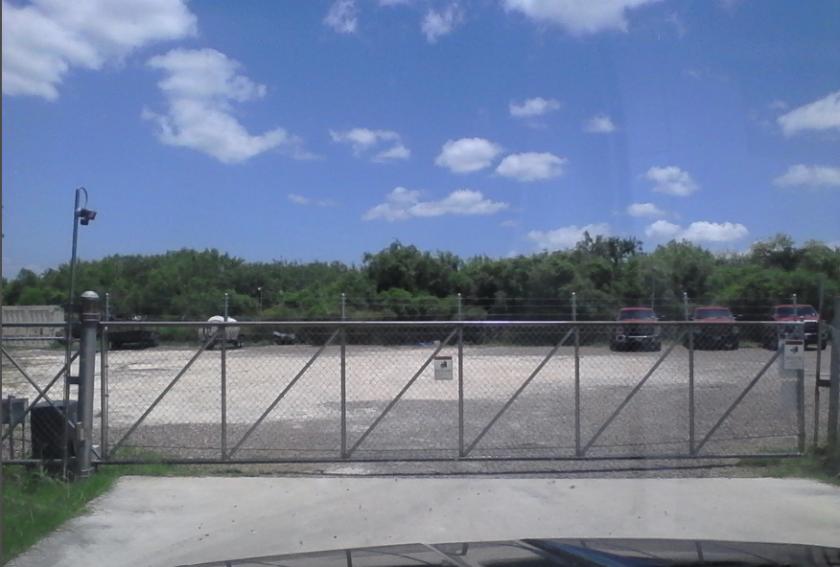
- • Fenced with auto gate
- • At intersection of major highways
Listing Agents

Charles Mader
O: 361-949-8282
M: 361-947-3947
cmader@stx.rr.com
O: 361-949-8282
M: 361-947-3947
cmader@stx.rr.com
While we strive to provide the most accurate information, all listing information, and demographic data, is provided by third-parties. As such, MyEListing will not be responsible for the accuracy of the information. It is strongly recommended that you verify all information with the listing agent, and any relevant agencies, prior to making any decisions.

