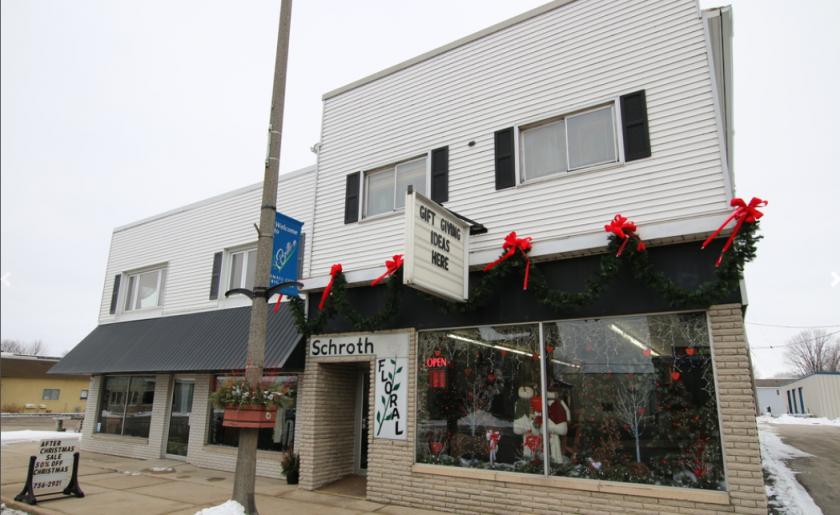
Retail Space
119 South Main Street Brillion, WI 54110
119 South Main Street Brillion, WI 54110
Details & Description
Property Highlights
- • -Main Street and Exterior parking
- • -City services for water, sewer, and refuse
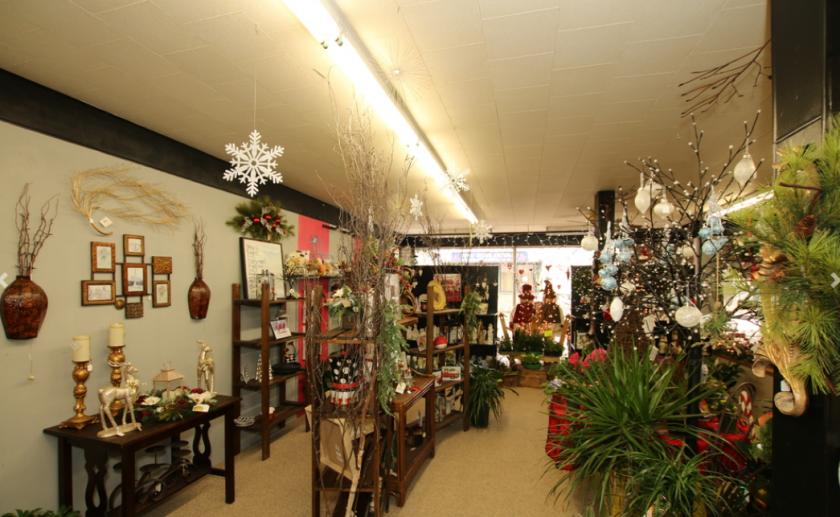
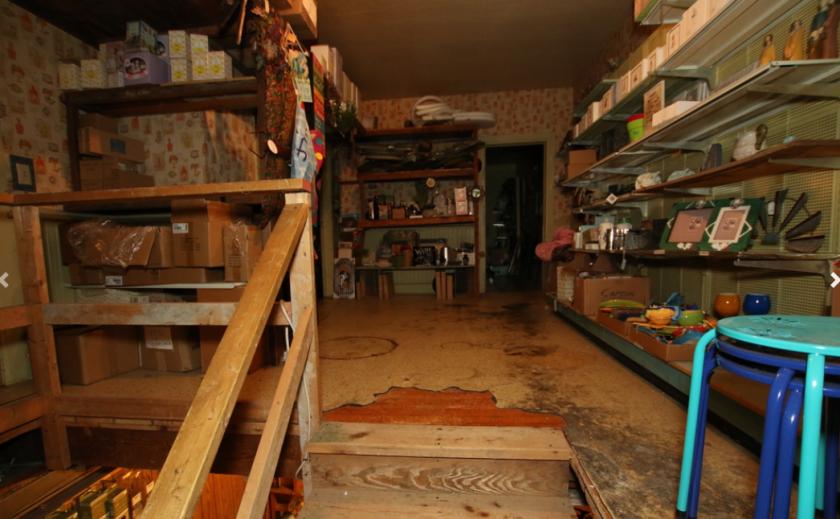
- • -Multiple uses for building
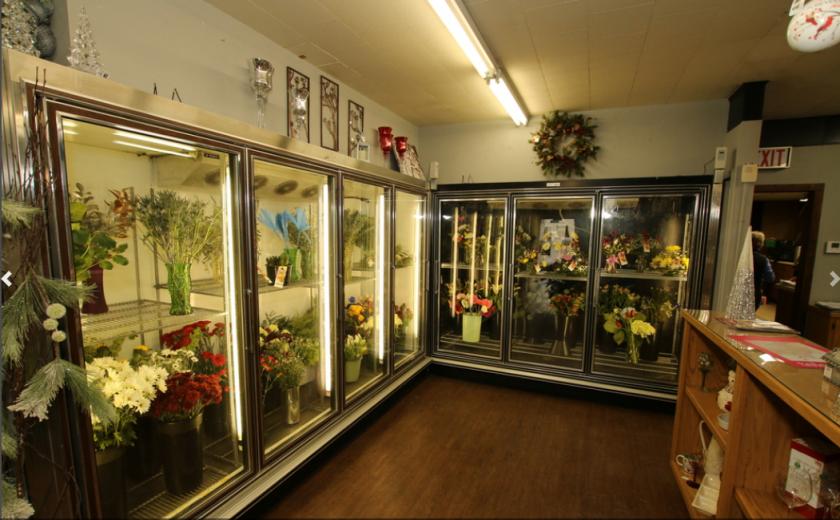
- • -Multiple walk-in coolers
Additional Photos

Listing Agents

Chris Mokler
O: 920-279-6104
chrismokler@kwcommercial.com
O: 920-279-6104
chrismokler@kwcommercial.com
While we strive to provide the most accurate information, all listing information, and demographic data, is provided by third-parties. As such, MyEListing will not be responsible for the accuracy of the information. It is strongly recommended that you verify all information with the listing agent, and any relevant agencies, prior to making any decisions.


