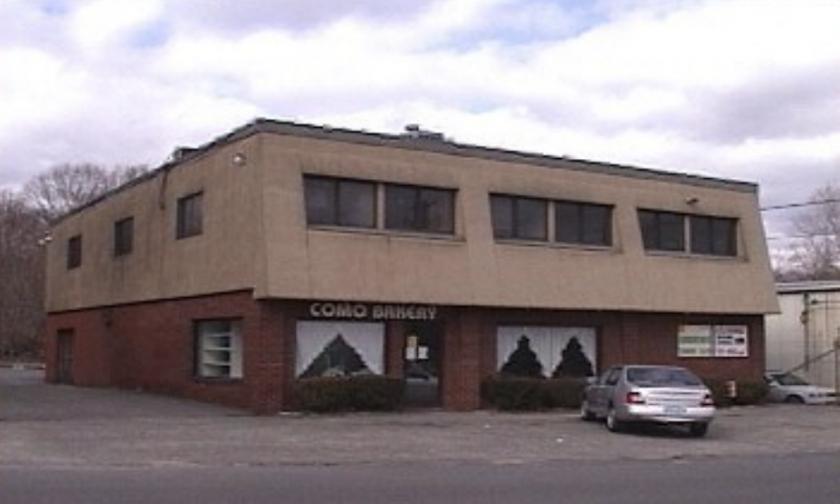
1-Mile | 3-Miles | 5-Miles | ||
---|---|---|---|---|
Total Population | 13,270 | 87,293 | 163,086 | |
Population Median Age | 36 | 37 | 38 | |
Population by Age | 0-9 Yrs | 1800 (13%) | 11471 (13%) | 21144 (12%) |
10-19 Yrs | 1609 (12%) | 11597 (13%) | 20484 (12%) | |
20-29 Yrs | 3057 (23%) | 13548 (15%) | 23061 (14%) | |
30-39 Yrs | 1517 (11%) | 11238 (12%) | 21365 (13%) | |
40-49 Yrs | 1456 (10%) | 11058 (12%) | 20429 (12%) | |
50-59 Yrs | 1552 (11%) | 11412 (13%) | 22477 (13%) | |
60-69 Yrs | 1103 (8%) | 8527 (9%) | 17729 (10%) | |
70+ Yrs | 1176 (8%) | 8442 (9%) | 16397 (10%) | |
Median HH Income | $47,739 | $46,590 | $53,915 | |
Total Household Income | < 24K | 1110 (22%) | 9568 (29%) | 15090 (24%) |
25-49K | 1406 (28%) | 7705 (23%) | 13750 (22%) | |
50-74K | 633 (12%) | 4927 (14%) | 9496 (15%) | |
75-99K | 815 (16%) | 3770 (11%) | 7392 (12%) | |
100-199K | 805 (16%) | 5646 (17%) | 12497 (20%) | |
200K+ | 138 (2%) | 1264 (3%) | 3001 (4%) | |
Highest Education Level | No Diploma | 1137 | 11318 | 17523 |
Diploma or GED | 3221 | 19898 | 38116 | |
Some College | 1663 | 11324 | 21639 | |
Assoc. Degree | 411 | 4150 | 8786 | |
Bachelors Degree | 1119 | 6369 | 13677 | |
Higher Degree | 726 | 4444 | 10147 | |
Total Housing Units | 5,424 | 38,421 | 69,628 | |
--Owner-Occupied | 2,409 | 15,233 | 32,386 | |
--Renter-Occupied | 2,498 | 17,648 | 28,840 | |
Owner-Occupied Values | < 100K | 596 | 3419 | 5725 |
100-199K | 1407 | 7245 | 14970 | |
200-299K | 286 | 3173 | 7110 | |
300-399K | 59 | 781 | 2613 | |
400-499K | 0 | 243 | 929 | |
500K+ | 61 | 371 | 1038 | |
Total Working Age Population | 10,753 | 68,638 | 129,494 | |
In Work Force | 6,865 | 43,416 | 83,138 | |
Not In Work Force | 3,887 | 25,222 | 46,356 | |
Workforce Employed | 6,250 | 39,415 | 76,384 | |
Workforce Unemployed | 615 | 3,971 | 6,681 | |
Civlian Workforce | 6,865 | 43,386 | 83,065 | |
Military Workforce | 0 | 30 | 73 | |
Total Households | 4,907 | 32,880 | 61,226 | |
Family Households | 3,059 | 20,170 | 39,279 | |
Non-Family Households | 1,847 | 12,710 | 21,946 | |
Married Couple | 1,559 | 11,253 | 24,056 | |
Other Family | 1,500 | 8,917 | 15,223 | |
Married w/Child | 635 | 4,655 | 9,286 | |
Single Male w/Child | 310 | 844 | 1,365 | |
Single Female w/Child | 556 | 3,965 | 6,586 |
Population Change Last Two Decades - Plus Projection
2000 | % | 2010 | % | 2020 | % | 2030 | |
---|---|---|---|---|---|---|---|
Connecticut | 3,405,565 | +5 | 3,574,097 | +1 | 3,604,603 | +1 | 3,633,994 |
Fairfield County | 882,567 | +4 | 916,829 | -1 | 907,603 | -1 | 897,553 |
Hartford County | 857,183 | +4 | 894,014 | +2 | 909,671 | +2 | 930,629 |
Litchfield County | 182,193 | +4 | 189,927 | -2 | 186,611 | -3 | 180,866 |
New Haven County | 824,008 | +5 | 862,477 | +1 | 873,659 | +2 | 891,371 |
Total Working Age Population:
Total Households:
Total Working Age Population:
Total Households:
Total Working Age Population:
Total Households: