Retail Space
3599 Northwest 23rd Avenue Miami, FL 33142
3599 Northwest 23rd Avenue Miami, FL 33142
Details & Description
Property Highlights
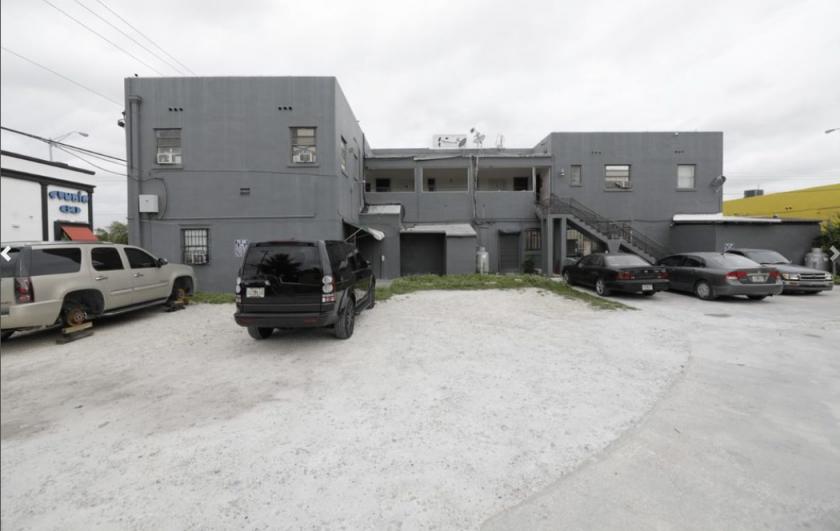
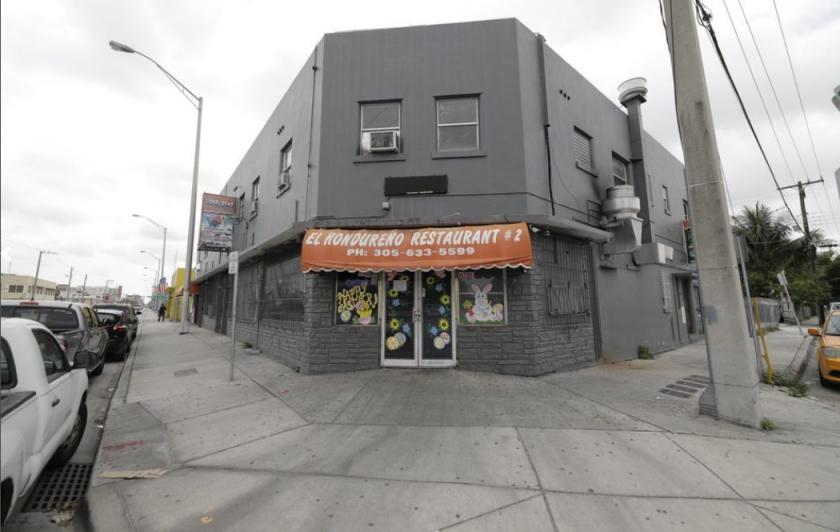
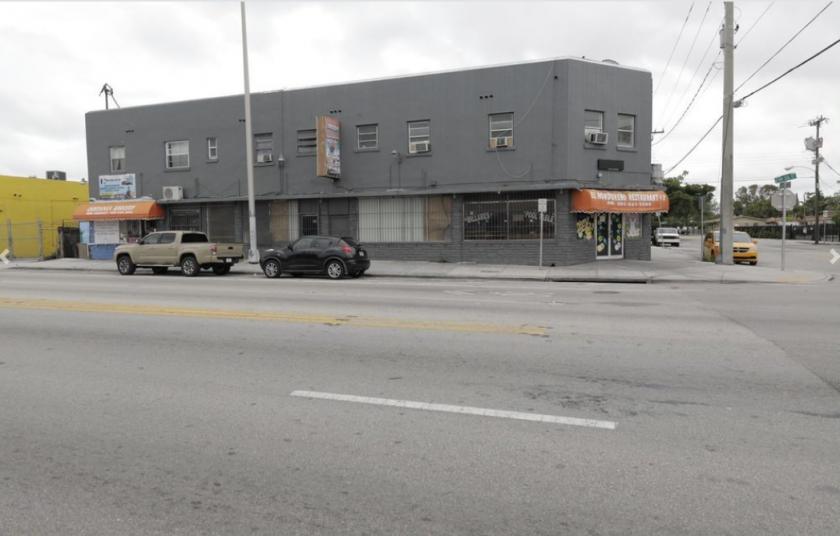
• Portfolio of 2 Assets - Assemblage For Sale Mixed-use building on 36 street assembled duplex on South-side.
• 20,836 Corner Lot Assemblage
Listing Agents

Enrique Luis Montoya
KW Commercial
O: 305-753-9826
M: 305-753-9826
enrique_montoya@kw.com
KW Commercial
O: 305-753-9826
M: 305-753-9826
enrique_montoya@kw.com
While we strive to provide the most accurate information, all listing information, and demographic data, is provided by third-parties. As such, MyEListing will not be responsible for the accuracy of the information. It is strongly recommended that you verify all information with the listing agent, and any relevant agencies, prior to making any decisions.