Multifamily Housing
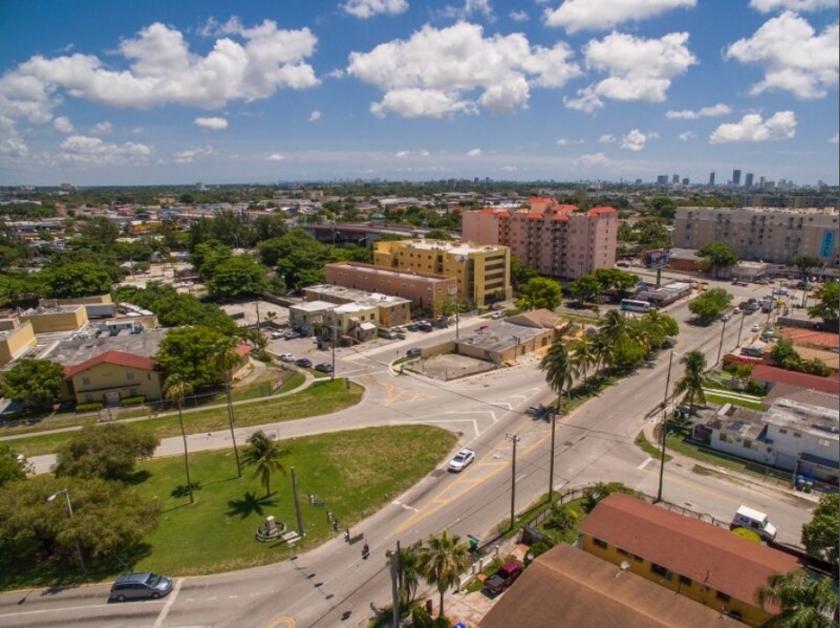
2765 Northwest 17th Terrace Miami, FL 33125
2765 Northwest 17th Terrace Miami, FL 33125
Details & Description
Property Highlights
- • Seller Financing Available
- • Great Opportunity to own Cash Flow Investment
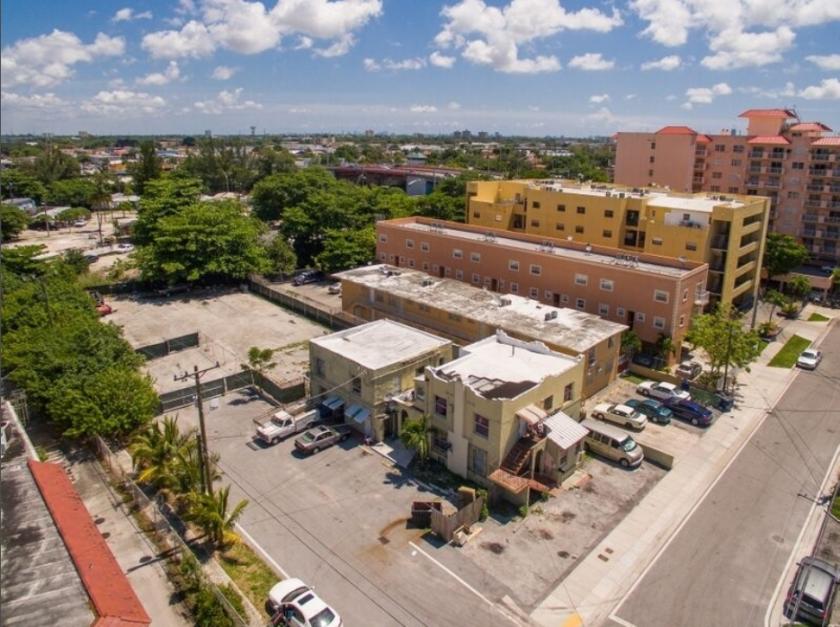
- • Fully Leased 6 unit Building Parking
- • 4 x 11 units 2 x 32 units parking lot leased
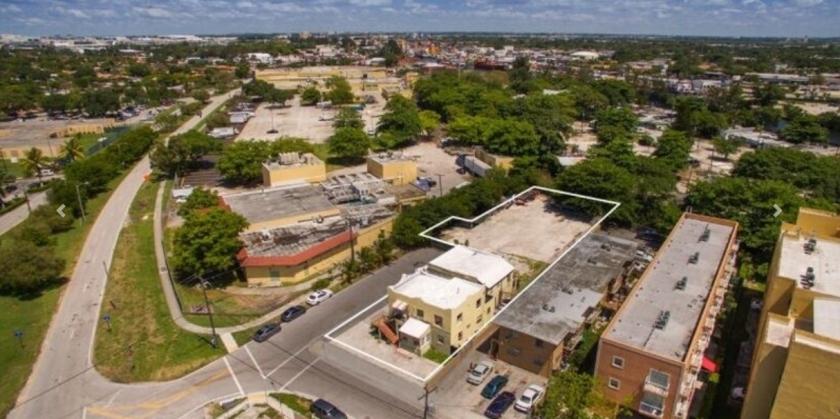
- • Next To Miami River
- • Excellent VALUE-ADD or REDEVELOPMENT opportunity
Listing Agents

Enrique Luis Montoya
KW Commercial
O: 305-753-9826
M: 305-753-9826
enrique_montoya@kw.com
KW Commercial
O: 305-753-9826
M: 305-753-9826
enrique_montoya@kw.com
While we strive to provide the most accurate information, all listing information, and demographic data, is provided by third-parties. As such, MyEListing will not be responsible for the accuracy of the information. It is strongly recommended that you verify all information with the listing agent, and any relevant agencies, prior to making any decisions.