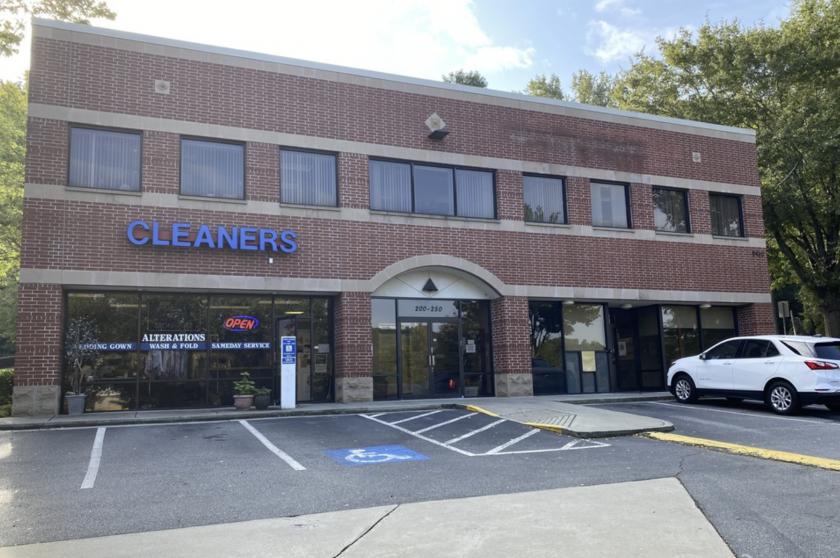
1-Mile | 3-Miles | 5-Miles | ||
---|---|---|---|---|
Total Population | 3,231 | 63,004 | 210,051 | |
Population Median Age | 46 | 38 | 38 | |
Population by Age | 0-9 Yrs | 255 (7%) | 6895 (10%) | 24159 (11%) |
10-19 Yrs | 456 (14%) | 7115 (11%) | 21532 (10%) | |
20-29 Yrs | 260 (8%) | 10616 (16%) | 35363 (16%) | |
30-39 Yrs | 221 (6%) | 10292 (16%) | 36094 (17%) | |
40-49 Yrs | 482 (14%) | 8640 (13%) | 28464 (13%) | |
50-59 Yrs | 471 (14%) | 8122 (12%) | 26993 (12%) | |
60-69 Yrs | 491 (15%) | 5828 (9%) | 19785 (9%) | |
70+ Yrs | 596 (18%) | 5495 (8%) | 17662 (8%) | |
Median HH Income | $164,442 | $86,552 | $83,490 | |
Total Household Income | < 24K | 101 (7%) | 2934 (10%) | 11022 (11%) |
25-49K | 130 (9%) | 4630 (16%) | 15978 (16%) | |
50-74K | 130 (9%) | 4757 (17%) | 16082 (17%) | |
75-99K | 112 (8%) | 3610 (12%) | 11568 (12%) | |
100-199K | 293 (21%) | 6568 (23%) | 22057 (23%) | |
200K+ | 581 (43%) | 5480 (19%) | 17315 (18%) | |
Highest Education Level | No Diploma | 6 | 2000 | 7060 |
Diploma or GED | 102 | 4333 | 16732 | |
Some College | 201 | 5263 | 19794 | |
Assoc. Degree | 82 | 2018 | 7049 | |
Bachelors Degree | 1050 | 18465 | 60244 | |
Higher Degree | 961 | 13004 | 40587 | |
Total Housing Units | 1,508 | 31,291 | 104,227 | |
--Owner-Occupied | 1,168 | 13,432 | 47,651 | |
--Renter-Occupied | 179 | 14,547 | 46,370 | |
Owner-Occupied Values | < 100K | 7 | 453 | 2085 |
100-199K | 127 | 1864 | 7921 | |
200-299K | 58 | 1226 | 6007 | |
300-399K | 98 | 1557 | 6604 | |
400-499K | 116 | 1387 | 5684 | |
500K+ | 763 | 6944 | 19351 | |
Total Working Age Population | 2,712 | 51,643 | 171,929 | |
In Work Force | 1,590 | 37,601 | 125,210 | |
Not In Work Force | 1,122 | 14,041 | 46,719 | |
Workforce Employed | 1,550 | 36,126 | 120,671 | |
Workforce Unemployed | 34 | 1,412 | 4,287 | |
Civlian Workforce | 1,584 | 37,539 | 124,958 | |
Military Workforce | 6 | 63 | 252 | |
Total Households | 1,347 | 27,979 | 94,021 | |
Family Households | 908 | 15,053 | 50,283 | |
Non-Family Households | 439 | 12,926 | 43,738 | |
Married Couple | 825 | 12,376 | 39,931 | |
Other Family | 83 | 2,677 | 10,352 | |
Married w/Child | 276 | 5,132 | 16,861 | |
Single Male w/Child | 6 | 404 | 1,349 | |
Single Female w/Child | 29 | 1,216 | 4,159 |
Population Change Last Two Decades - Plus Projection
2000 | % | 2010 | % | 2020 | % | 2030 | |
---|---|---|---|---|---|---|---|
Georgia | 8,186,453 | +18 | 9,687,653 | +12 | 10,833,472 | +13 | 12,292,423 |
Cobb County | 607,751 | +13 | 688,078 | +15 | 790,588 | +19 | 938,747 |
DeKalb County | 665,865 | +4 | 691,893 | +15 | 793,154 | +19 | 944,045 |
Fulton County | 816,006 | +13 | 920,581 | +19 | 1,099,181 | +18 | 1,300,861 |
Total Working Age Population:
Total Households:
Total Working Age Population:
Total Households:
Total Working Age Population:
Total Households: