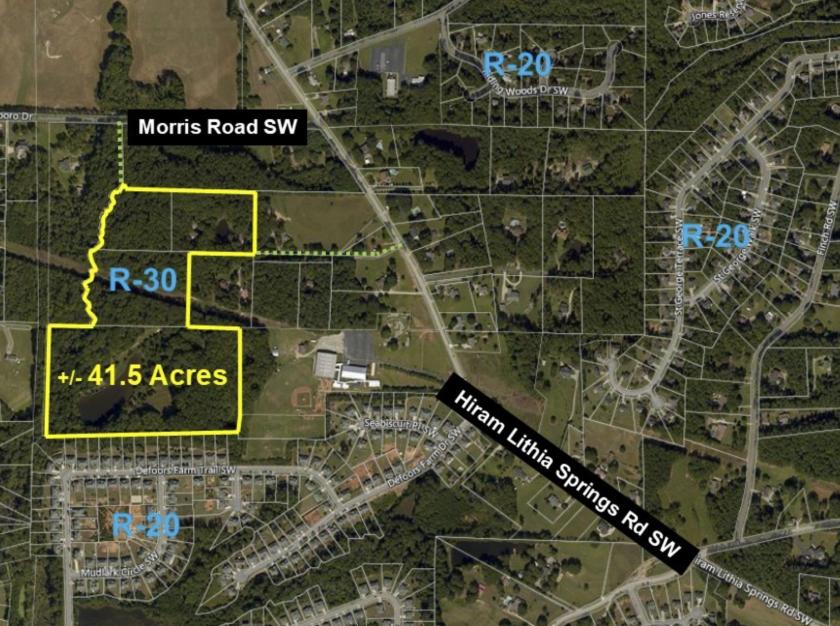
1-Mile | 3-Miles | 5-Miles | ||
---|---|---|---|---|
Total Population | 3,646 | 34,294 | 90,767 | |
Population Median Age | 38 | 37 | 37 | |
Population by Age | 0-9 Yrs | 466 (12%) | 4575 (13%) | 11686 (12%) |
10-19 Yrs | 447 (12%) | 5264 (15%) | 13496 (14%) | |
20-29 Yrs | 465 (12%) | 4186 (12%) | 11257 (12%) | |
30-39 Yrs | 473 (12%) | 4425 (12%) | 11393 (12%) | |
40-49 Yrs | 491 (13%) | 4711 (13%) | 13112 (14%) | |
50-59 Yrs | 703 (19%) | 5395 (15%) | 14349 (15%) | |
60-69 Yrs | 379 (10%) | 3523 (10%) | 9122 (10%) | |
70+ Yrs | 223 (6%) | 2215 (6%) | 6352 (6%) | |
Median HH Income | $69,545 | $71,023 | $69,700 | |
Total Household Income | < 24K | 263 (20%) | 1409 (12%) | 3814 (12%) |
25-49K | 259 (20%) | 2293 (20%) | 6251 (20%) | |
50-74K | 157 (12%) | 2296 (20%) | 6507 (21%) | |
75-99K | 153 (11%) | 1786 (15%) | 4639 (15%) | |
100-199K | 392 (30%) | 2995 (26%) | 7967 (26%) | |
200K+ | 61 (4%) | 452 (4%) | 1333 (4%) | |
Highest Education Level | No Diploma | 328 | 2288 | 5945 |
Diploma or GED | 695 | 6252 | 17442 | |
Some College | 496 | 5011 | 13895 | |
Assoc. Degree | 235 | 2141 | 5498 | |
Bachelors Degree | 560 | 4630 | 11374 | |
Higher Degree | 203 | 2267 | 6180 | |
Total Housing Units | 1,338 | 11,854 | 32,194 | |
--Owner-Occupied | 892 | 8,330 | 23,555 | |
--Renter-Occupied | 392 | 2,900 | 6,956 | |
Owner-Occupied Values | < 100K | 122 | 923 | 2886 |
100-199K | 375 | 4382 | 12215 | |
200-299K | 281 | 1984 | 5091 | |
300-399K | 87 | 637 | 2255 | |
400-499K | 12 | 194 | 520 | |
500K+ | 16 | 210 | 588 | |
Total Working Age Population | 2,979 | 26,798 | 71,379 | |
In Work Force | 2,001 | 18,064 | 47,924 | |
Not In Work Force | 978 | 8,735 | 23,455 | |
Workforce Employed | 1,891 | 17,063 | 45,551 | |
Workforce Unemployed | 104 | 964 | 2,317 | |
Civlian Workforce | 1,995 | 18,027 | 47,868 | |
Military Workforce | 6 | 36 | 56 | |
Total Households | 1,285 | 11,230 | 30,512 | |
Family Households | 926 | 8,691 | 23,812 | |
Non-Family Households | 358 | 2,540 | 6,700 | |
Married Couple | 711 | 6,190 | 17,177 | |
Other Family | 215 | 2,500 | 6,635 | |
Married w/Child | 266 | 2,670 | 7,403 | |
Single Male w/Child | 18 | 243 | 662 | |
Single Female w/Child | 121 | 1,130 | 2,582 |
Population Change Last Two Decades - Plus Projection
2000 | % | 2010 | % | 2020 | % | 2030 | |
---|---|---|---|---|---|---|---|
Georgia | 8,186,453 | +18 | 9,687,653 | +12 | 10,833,472 | +13 | 12,292,423 |
Cobb County | 607,751 | +13 | 688,078 | +15 | 790,588 | +19 | 938,747 |
Douglas County | 92,174 | +44 | 132,403 | +15 | 151,906 | +20 | 182,157 |
Fulton County | 816,006 | +13 | 920,581 | +19 | 1,099,181 | +18 | 1,300,861 |
Paulding County | 81,678 | +74 | 142,324 | +21 | 172,542 | +21 | 208,525 |
Total Working Age Population:
Total Households:
Total Working Age Population:
Total Households:
Total Working Age Population:
Total Households: