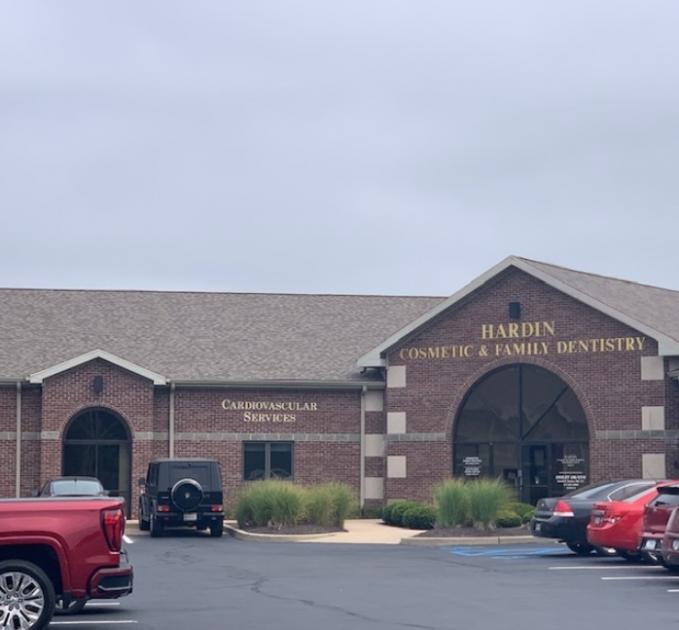
Office Space
7855 South Emerson Avenue Indianapolis, IN 46237
7855 South Emerson Avenue Indianapolis, IN 46237
Details & Description
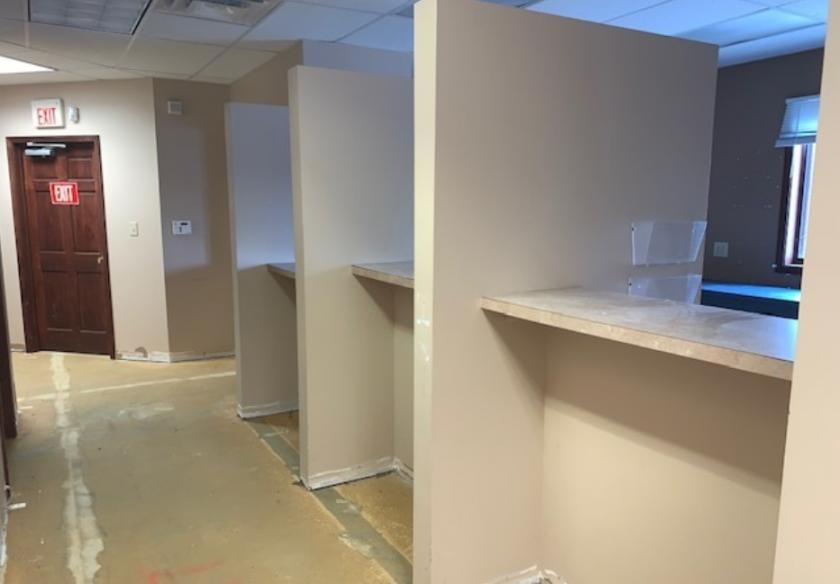
Property Highlights
- • Large Nurses Station
- • Functional Front Office and Checkout Areas
- • Large Waiting Room
Listing Agents

Julie Merrill
O: 317-560-9966
M: 317-846-6300
juliemerrill@kw.com
O: 317-560-9966
M: 317-846-6300
juliemerrill@kw.com

Teresa Harwood
O: 317-883-7010
M: 317-354-5236
tharwood@kw.com
O: 317-883-7010
M: 317-354-5236
tharwood@kw.com
While we strive to provide the most accurate information, all listing information, and demographic data, is provided by third-parties. As such, MyEListing will not be responsible for the accuracy of the information. It is strongly recommended that you verify all information with the listing agent, and any relevant agencies, prior to making any decisions.