Specialty Real Estate
1935 West 51st Street Chicago, IL 60609
1935 West 51st Street Chicago, IL 60609
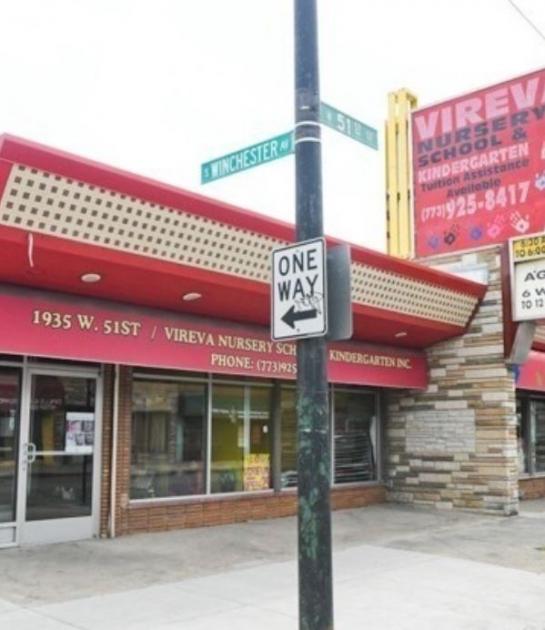
Details & Description
Property Highlights
- • The property is well maintained,
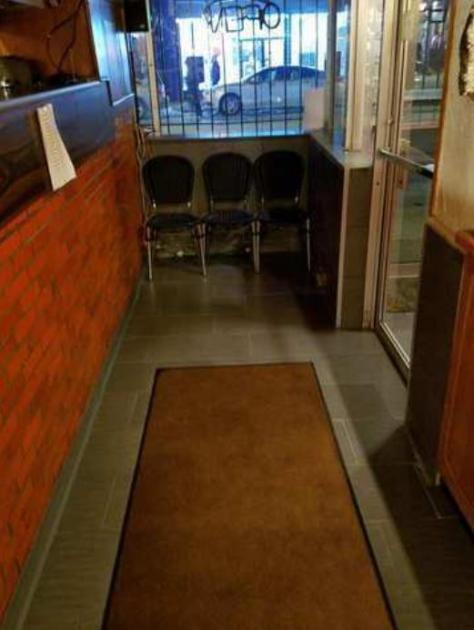
- • Reception area,
- • Private offices
- • Open area for cubicles
- • Conference rooms,
- • Break room andor printer room,
Additional Photos


Listing Agents

William Mustafa
KW Commercial
O: 312-471-6444
M: 708-261-1150
wmustafa@kwcommercial.com
KW Commercial
O: 312-471-6444
M: 708-261-1150
wmustafa@kwcommercial.com
While we strive to provide the most accurate information, all listing information, and demographic data, is provided by third-parties. As such, MyEListing will not be responsible for the accuracy of the information. It is strongly recommended that you verify all information with the listing agent, and any relevant agencies, prior to making any decisions.


