Office Space
87 Vickery Street Roswell, GA 30075
87 Vickery Street Roswell, GA 30075

Details & Description
Property Highlights
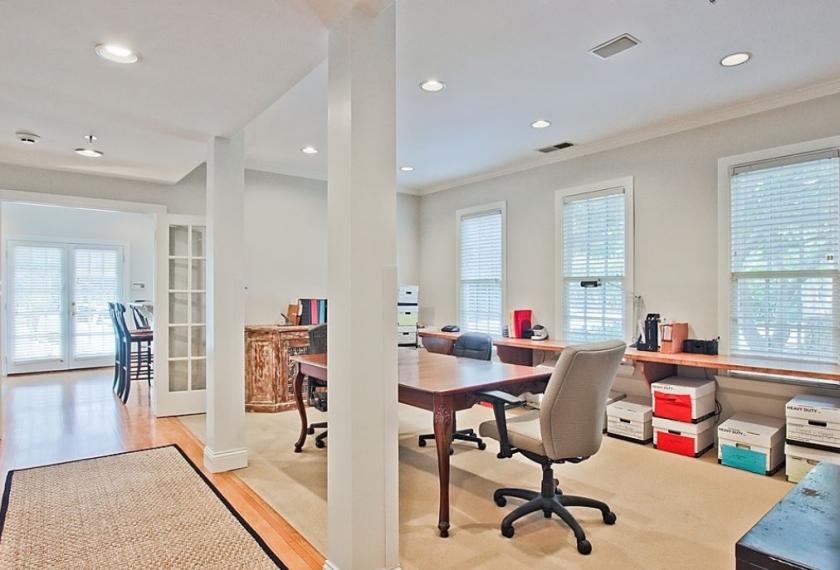
• Great offices layout and additional open floorplan area
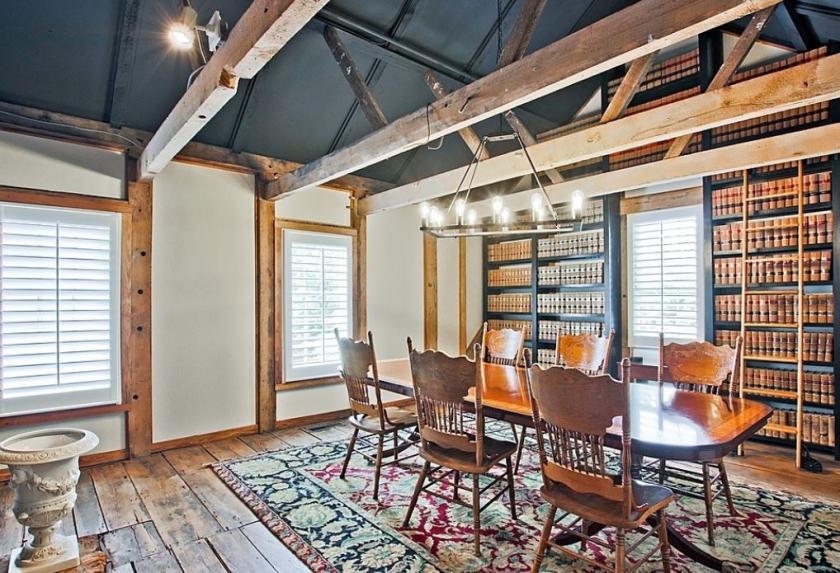
• Many historical features remain as part of the charm
Additional Photos

Listing Agents

Scott Morchower
KW Commercial
O: 678-495-1852
M: 770-310-9575
smorchower@kw.com
KW Commercial
O: 678-495-1852
M: 770-310-9575
smorchower@kw.com
While we strive to provide the most accurate information, all listing information, and demographic data, is provided by third-parties. As such, MyEListing will not be responsible for the accuracy of the information. It is strongly recommended that you verify all information with the listing agent, and any relevant agencies, prior to making any decisions.


