Retail Space
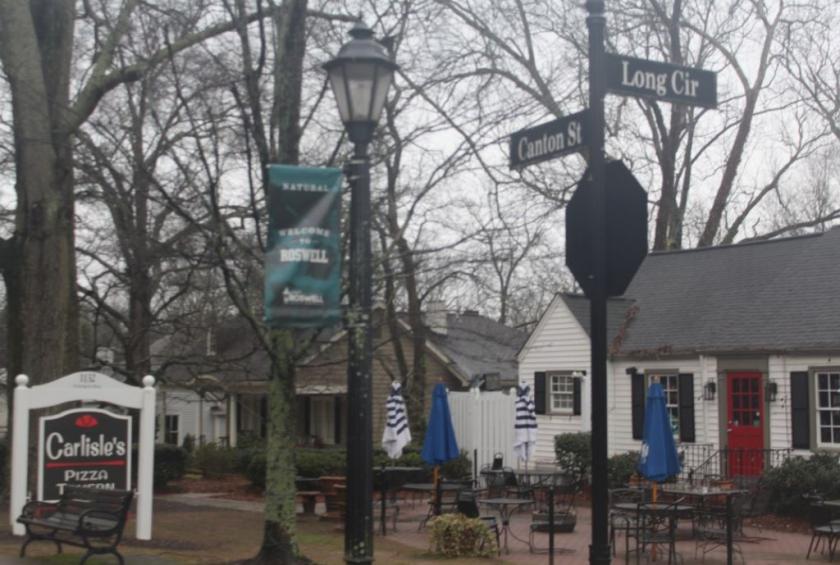
1132 Canton Street Roswell, GA 30075
1132 Canton Street Roswell, GA 30075
Details & Description
Property Highlights
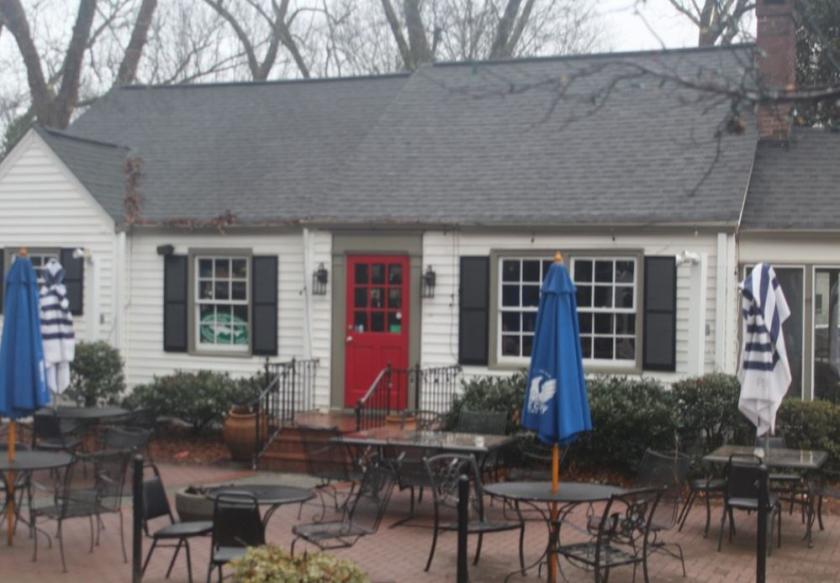
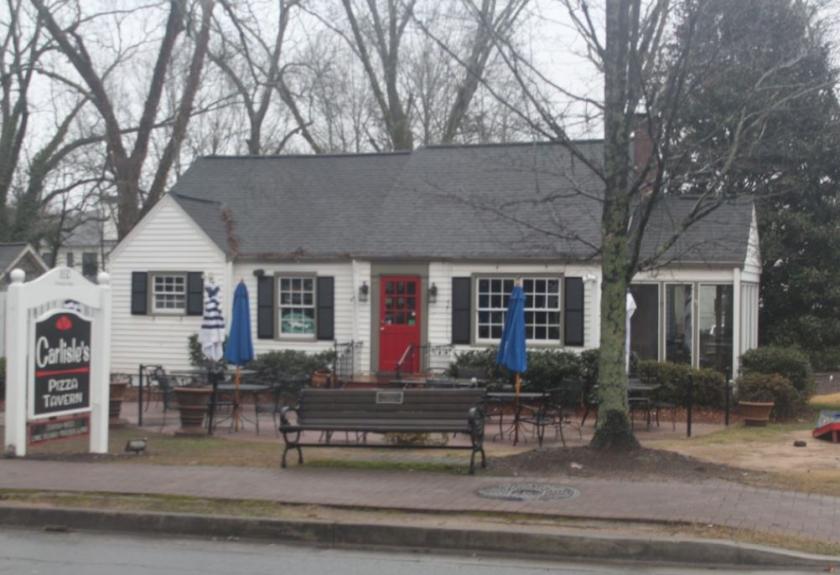
- • Heart of the bustling Canton St experience
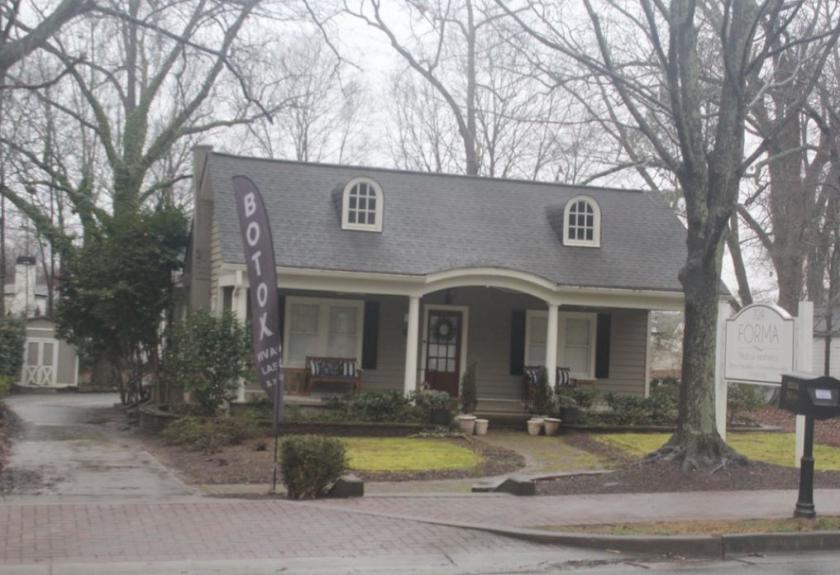
- • 2 Property Portfolio sold together as a package
- • 1132 1124 Canton St
- • Quality tenants
- • Lots of Parking on site
- • Corner Lot
Additional Photos
Listing Agents

Scott Morchower
KW Commercial
O: 678-495-1852
M: 770-310-9575
smorchower@kw.com
KW Commercial
O: 678-495-1852
M: 770-310-9575
smorchower@kw.com
While we strive to provide the most accurate information, all listing information, and demographic data, is provided by third-parties. As such, MyEListing will not be responsible for the accuracy of the information. It is strongly recommended that you verify all information with the listing agent, and any relevant agencies, prior to making any decisions.


