Office Space
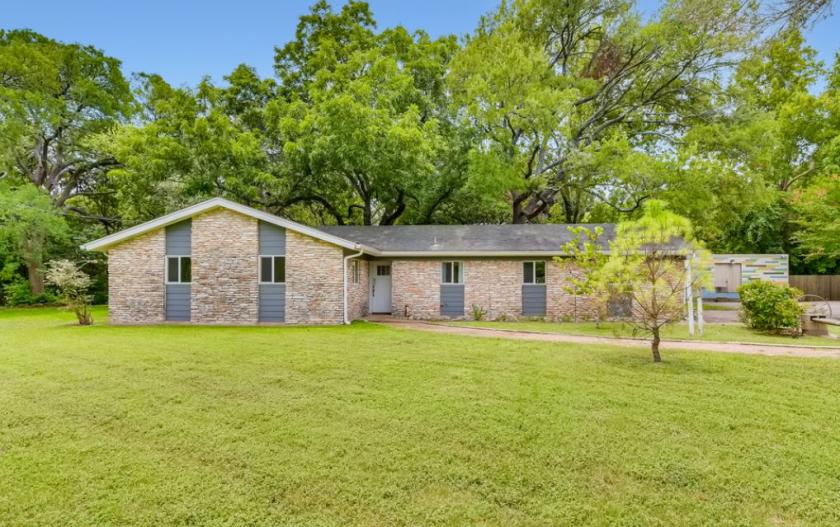
8101w State Highway 71 Austin, TX 78735
8101w State Highway 71 Austin, TX 78735

Details & Description
Property Highlights
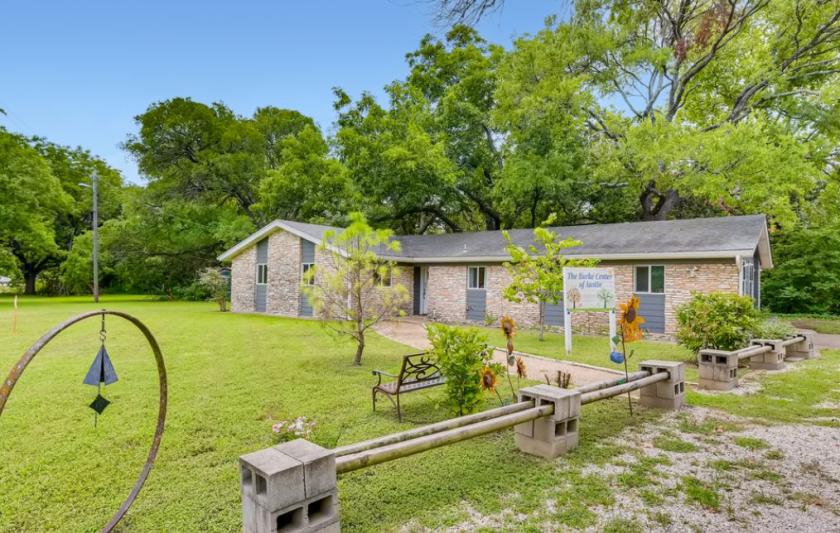
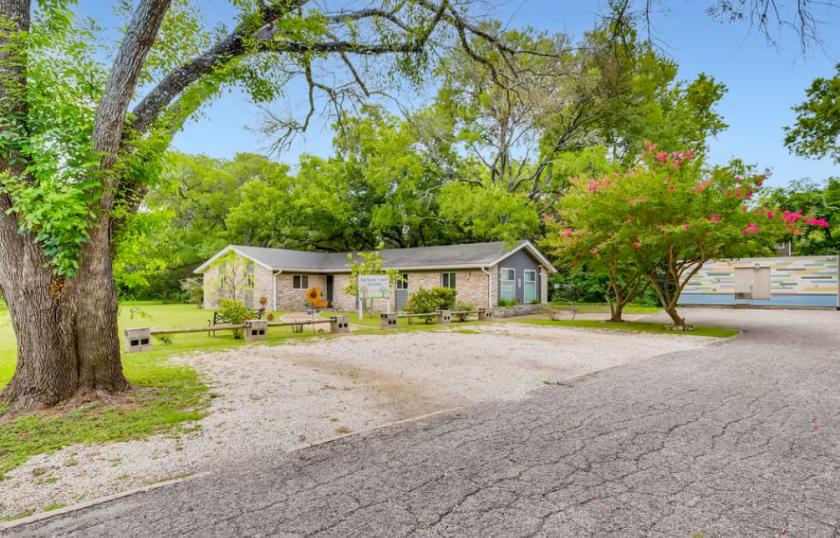
- • Hard to find stand-alone office building
- • LO-NP zoning
- • Remodeled in 2014
Additional Photos
Listing Agents

Heather Morrison
O: 512-940-0565
heather.morrison@kw.com
O: 512-940-0565
heather.morrison@kw.com
While we strive to provide the most accurate information, all listing information, and demographic data, is provided by third-parties. As such, MyEListing will not be responsible for the accuracy of the information. It is strongly recommended that you verify all information with the listing agent, and any relevant agencies, prior to making any decisions.


