Specialty Real Estate
798 Route 115 Saylorsburg, PA 18353
798 Route 115 Saylorsburg, PA 18353

Details & Description
Property Highlights
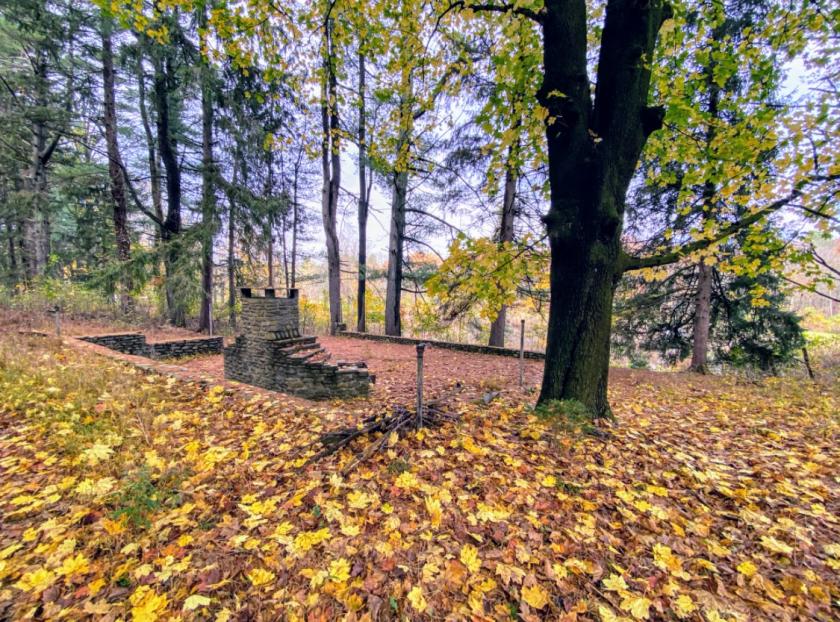
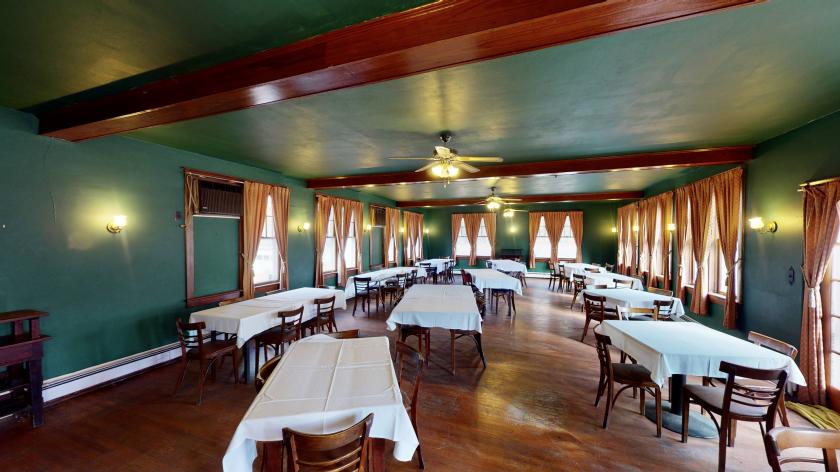
- • PERFECT VENUE SETTING
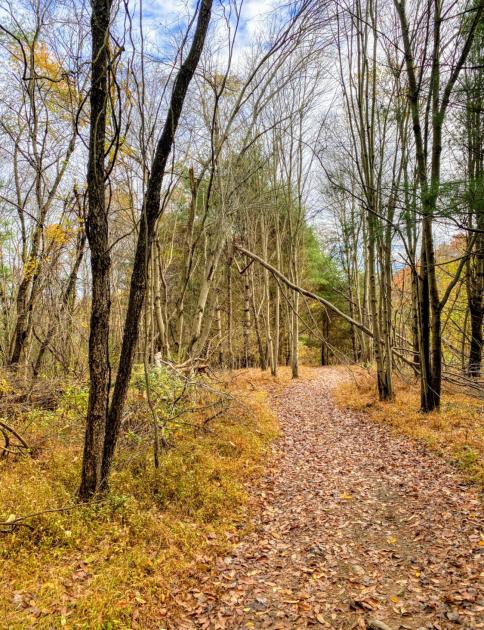
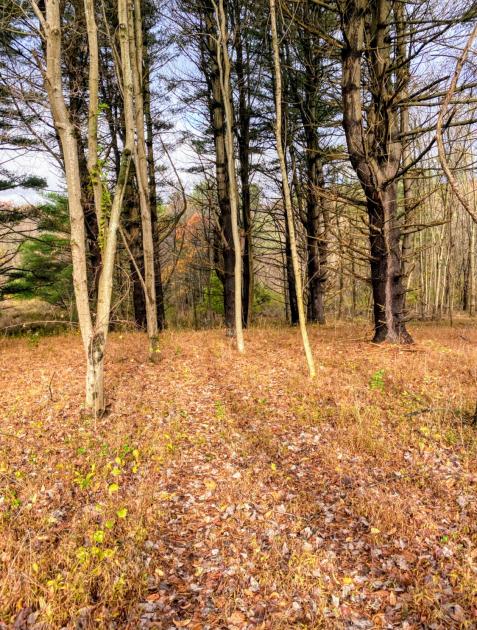
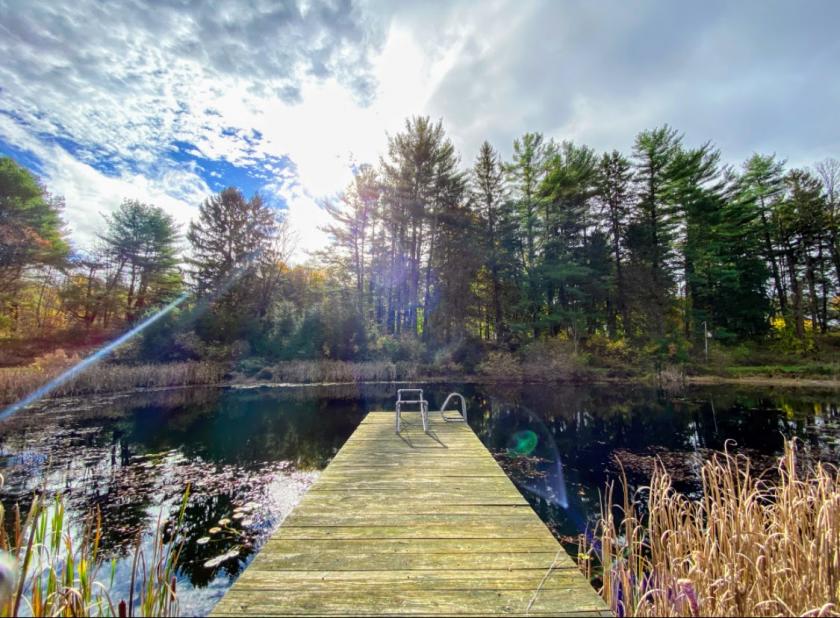
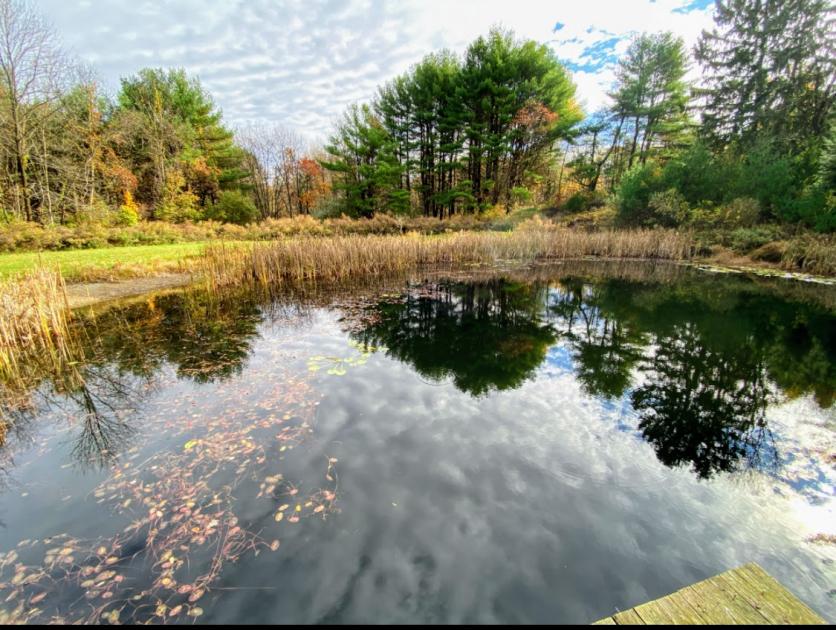
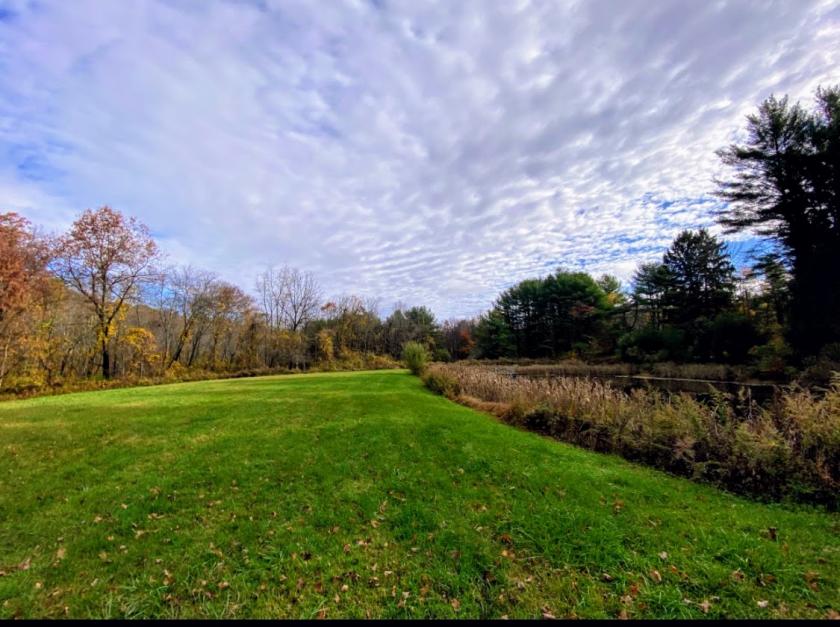
- • 14 PRESTINE ACRES WITH POND
- • COMMERCIAL LOCATION
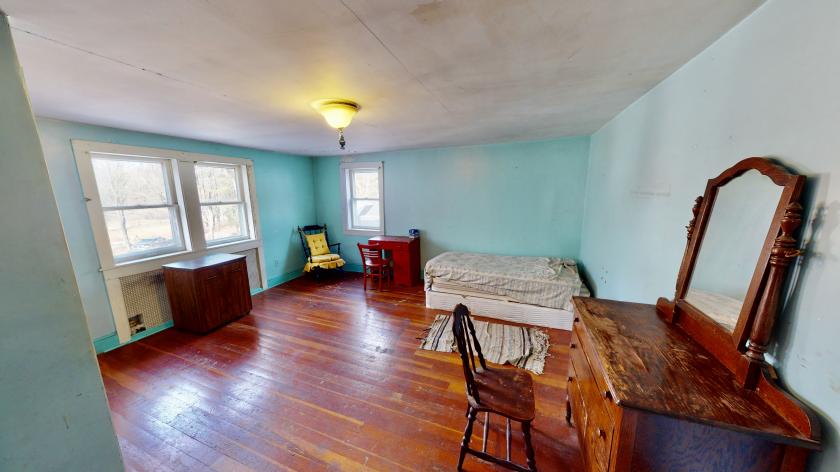
- • OVER 23 BEDROOMS AND 17 BATHROOMS
- • PHASE 3 ELECTRIC
- • CITY WATER
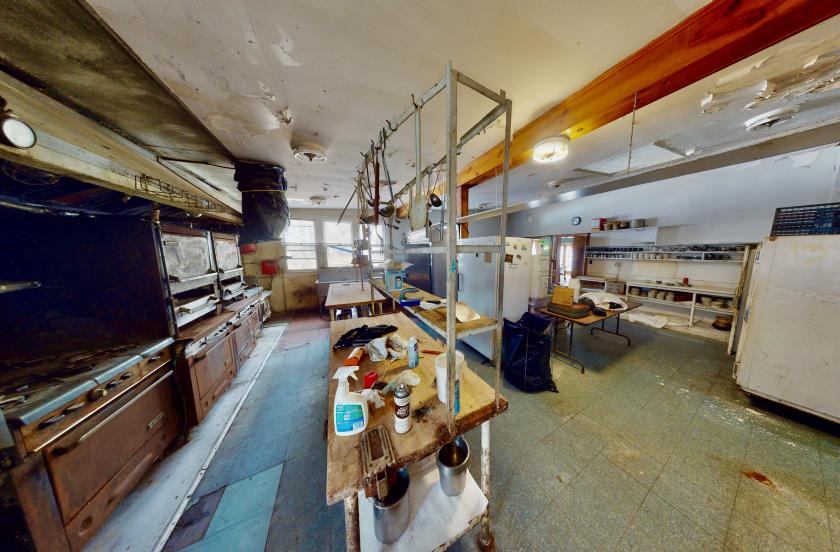
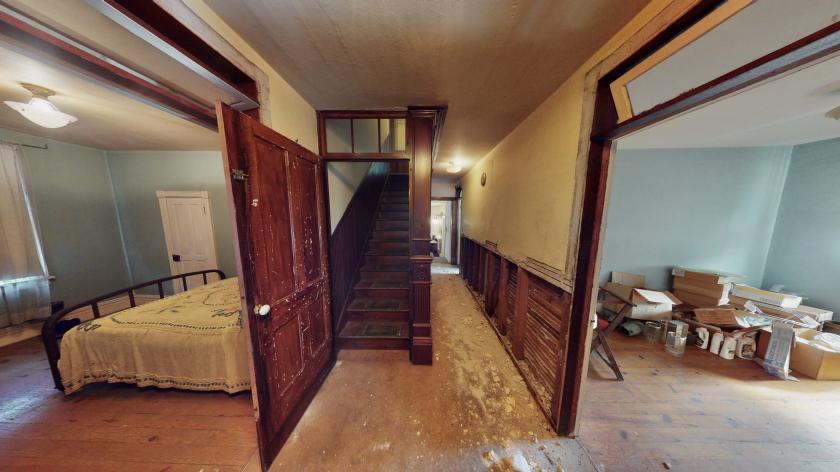
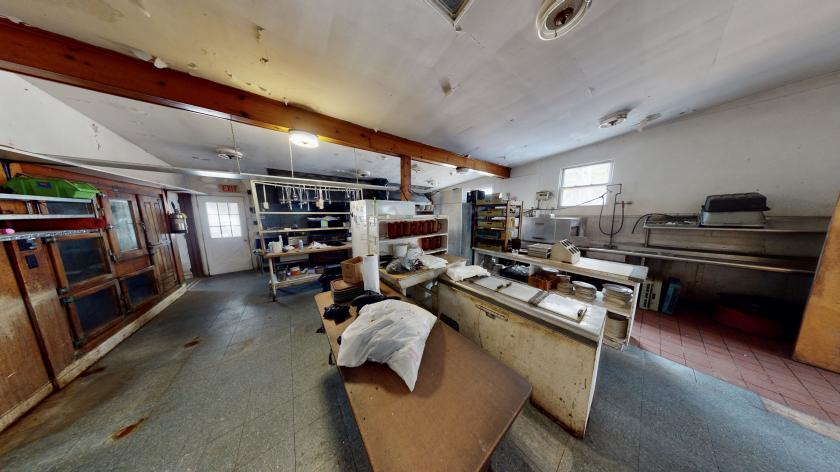
Additional Photos


Listing Agents

Kara Sincavage
pocprop@gmail.com
pocprop@gmail.com
While we strive to provide the most accurate information, all listing information, and demographic data, is provided by third-parties. As such, MyEListing will not be responsible for the accuracy of the information. It is strongly recommended that you verify all information with the listing agent, and any relevant agencies, prior to making any decisions.