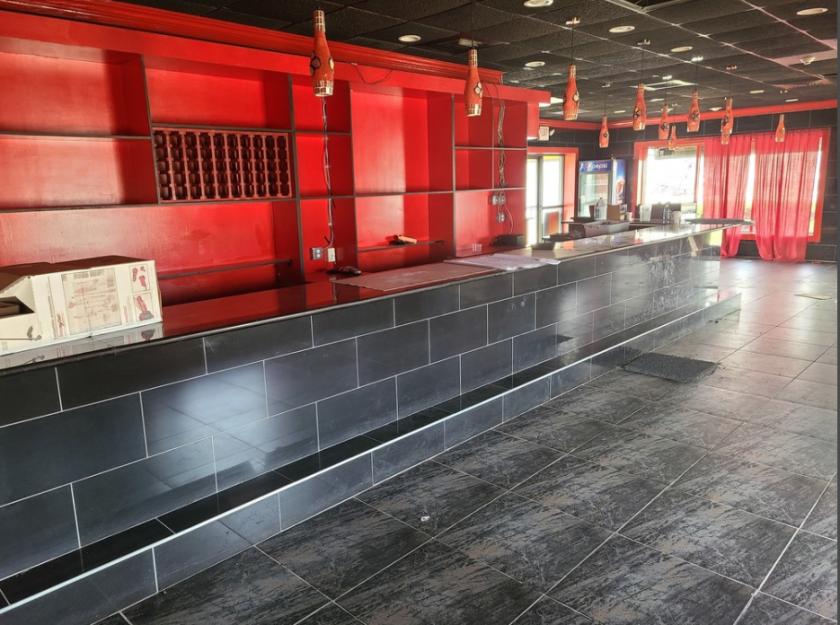
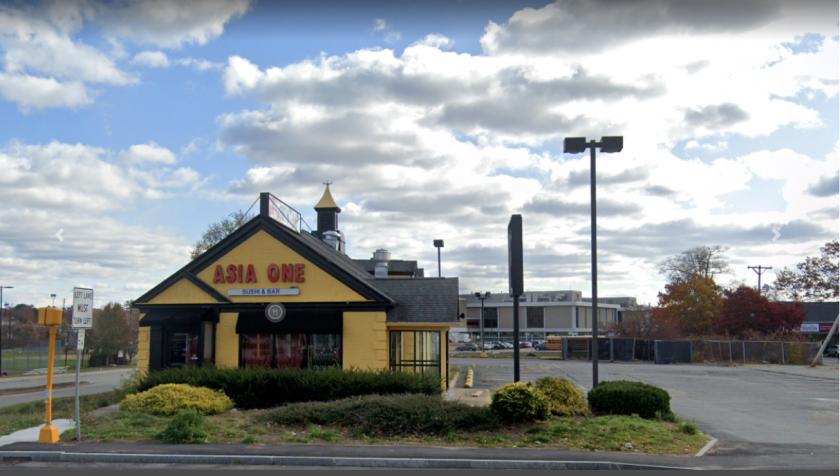
1-Mile | 3-Miles | 5-Miles | ||
---|---|---|---|---|
Total Population | 11,768 | 91,067 | 154,031 | |
Population Median Age | 37 | 37 | 38 | |
Population by Age | 0-9 Yrs | 1761 (14%) | 11864 (13%) | 18209 (11%) |
10-19 Yrs | 1514 (12%) | 13704 (15%) | 22270 (14%) | |
20-29 Yrs | 1660 (14%) | 13087 (14%) | 20430 (13%) | |
30-39 Yrs | 1375 (11%) | 12495 (13%) | 20256 (13%) | |
40-49 Yrs | 1346 (11%) | 11023 (12%) | 19432 (12%) | |
50-59 Yrs | 1644 (13%) | 11543 (12%) | 21547 (13%) | |
60-69 Yrs | 1447 (12%) | 9383 (10%) | 17489 (11%) | |
70+ Yrs | 1021 (8%) | 7968 (8%) | 14397 (9%) | |
Median HH Income | $83,962 | $59,307 | $73,430 | |
Total Household Income | < 24K | 438 (12%) | 6960 (22%) | 9104 (17%) |
25-49K | 710 (20%) | 6382 (21%) | 9347 (17%) | |
50-74K | 388 (11%) | 4406 (14%) | 8050 (15%) | |
75-99K | 565 (16%) | 3740 (12%) | 6714 (12%) | |
100-199K | 1138 (32%) | 7260 (23%) | 15137 (29%) | |
200K+ | 239 (6%) | 1551 (5%) | 3672 (7%) | |
Highest Education Level | No Diploma | 1269 | 11365 | 14660 |
Diploma or GED | 2273 | 18729 | 32117 | |
Some College | 1395 | 11661 | 20099 | |
Assoc. Degree | 603 | 4305 | 8959 | |
Bachelors Degree | 1408 | 8750 | 17654 | |
Higher Degree | 609 | 3695 | 9293 | |
Total Housing Units | 3,676 | 32,334 | 55,153 | |
--Owner-Occupied | 2,541 | 15,721 | 33,382 | |
--Renter-Occupied | 937 | 14,578 | 18,643 | |
Owner-Occupied Values | < 100K | 50 | 525 | 984 |
100-199K | 191 | 2233 | 3566 | |
200-299K | 1092 | 6313 | 11439 | |
300-399K | 983 | 4301 | 10100 | |
400-499K | 136 | 1246 | 3839 | |
500K+ | 88 | 1103 | 3454 | |
Total Working Age Population | 8,915 | 71,170 | 123,199 | |
In Work Force | 6,299 | 48,345 | 84,664 | |
Not In Work Force | 2,616 | 22,825 | 38,535 | |
Workforce Employed | 5,938 | 44,444 | 79,053 | |
Workforce Unemployed | 356 | 3,868 | 5,573 | |
Civlian Workforce | 6,294 | 48,312 | 84,626 | |
Military Workforce | 5 | 33 | 38 | |
Total Households | 3,478 | 30,300 | 52,025 | |
Family Households | 2,532 | 20,252 | 36,401 | |
Non-Family Households | 946 | 10,048 | 15,623 | |
Married Couple | 1,560 | 11,201 | 23,346 | |
Other Family | 972 | 9,050 | 13,056 | |
Married w/Child | 713 | 5,036 | 9,869 | |
Single Male w/Child | 129 | 1,082 | 1,481 | |
Single Female w/Child | 407 | 4,064 | 5,471 |
Population Change Last Two Decades - Plus Projection
2000 | % | 2010 | % | 2020 | % | 2030 | |
---|---|---|---|---|---|---|---|
Massachusetts | 6,349,097 | +3 | 6,547,629 | +6 | 6,933,887 | +4 | 7,225,472 |
Bristol County | 534,678 | +3 | 548,285 | +2 | 561,478 | +1 | 567,277 |
Norfolk County | 650,308 | +3 | 670,850 | +7 | 718,394 | +7 | 765,912 |
Plymouth County | 472,822 | +5 | 494,919 | +5 | 518,508 | +3 | 534,464 |
Total Working Age Population:
Total Households:
Total Working Age Population:
Total Households:
Total Working Age Population:
Total Households: