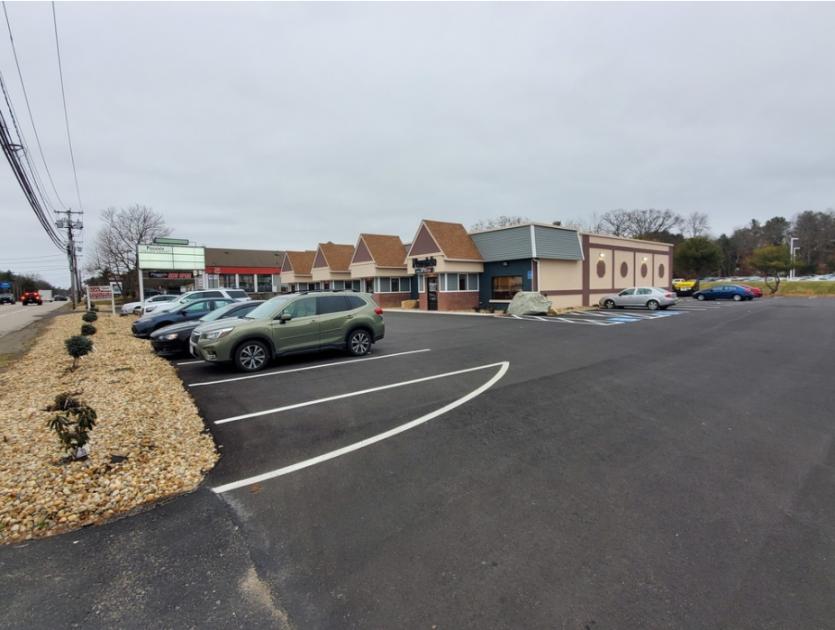
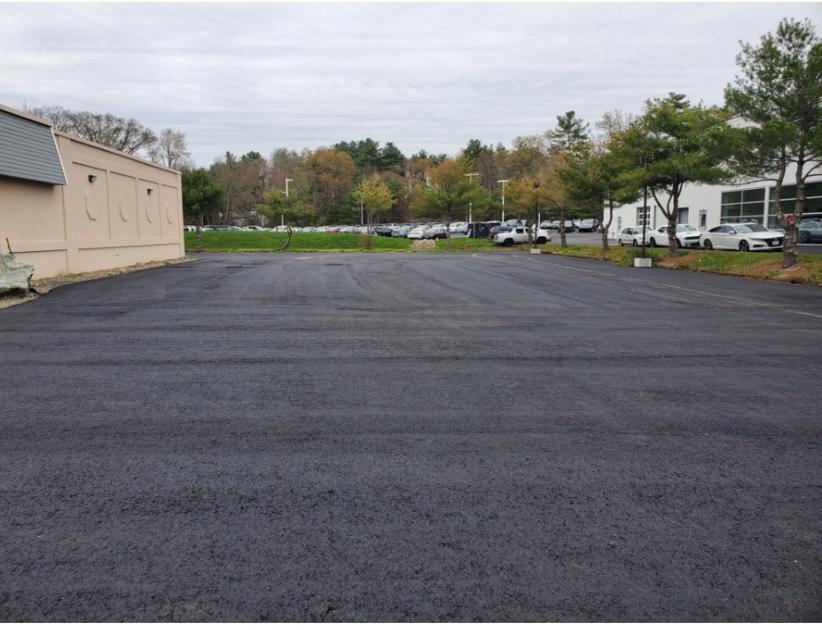
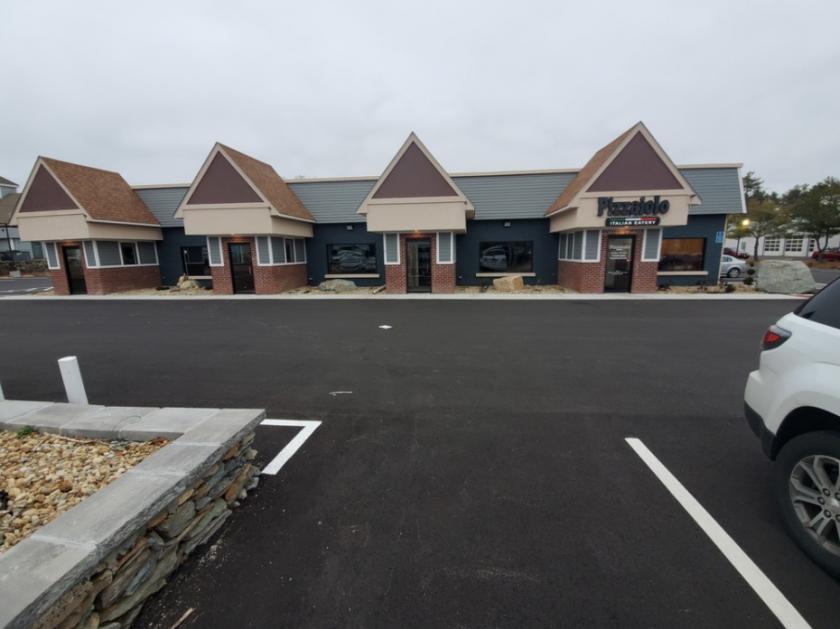
1-Mile | 3-Miles | 5-Miles | ||
---|---|---|---|---|
Total Population | 1,654 | 17,500 | 70,068 | |
Population Median Age | 41 | 41 | 39 | |
Population by Age | 0-9 Yrs | 212 (12%) | 1927 (11%) | 8213 (11%) |
10-19 Yrs | 204 (12%) | 2101 (12%) | 9080 (12%) | |
20-29 Yrs | 118 (7%) | 2031 (11%) | 8570 (12%) | |
30-39 Yrs | 242 (14%) | 2331 (13%) | 9898 (14%) | |
40-49 Yrs | 210 (12%) | 2243 (12%) | 9322 (13%) | |
50-59 Yrs | 263 (15%) | 2675 (15%) | 10235 (14%) | |
60-69 Yrs | 165 (9%) | 2047 (11%) | 7866 (11%) | |
70+ Yrs | 241 (14%) | 2144 (12%) | 6885 (9%) | |
Median HH Income | $128,379 | $95,518 | $74,404 | |
Total Household Income | < 24K | 48 (7%) | 831 (12%) | 4543 (17%) |
25-49K | 71 (11%) | 807 (12%) | 4929 (19%) | |
50-74K | 64 (10%) | 848 (12%) | 3554 (13%) | |
75-99K | 49 (7%) | 968 (14%) | 3304 (12%) | |
100-199K | 246 (39%) | 2399 (36%) | 7555 (29%) | |
200K+ | 138 (22%) | 707 (10%) | 2013 (7%) | |
Highest Education Level | No Diploma | 61 | 1232 | 5802 |
Diploma or GED | 249 | 3435 | 15557 | |
Some College | 151 | 2273 | 9035 | |
Assoc. Degree | 79 | 1086 | 4517 | |
Bachelors Degree | 442 | 3092 | 9371 | |
Higher Degree | 199 | 1497 | 4529 | |
Total Housing Units | 618 | 6,758 | 27,669 | |
--Owner-Occupied | 547 | 5,495 | 16,987 | |
--Renter-Occupied | 70 | 1,065 | 8,912 | |
Owner-Occupied Values | < 100K | 41 | 338 | 764 |
100-199K | 53 | 841 | 2113 | |
200-299K | 53 | 1206 | 5085 | |
300-399K | 142 | 1657 | 5131 | |
400-499K | 86 | 702 | 2208 | |
500K+ | 173 | 751 | 1686 | |
Total Working Age Population | 1,296 | 14,328 | 56,576 | |
In Work Force | 931 | 10,093 | 38,246 | |
Not In Work Force | 365 | 4,235 | 18,330 | |
Workforce Employed | 879 | 9,499 | 35,914 | |
Workforce Unemployed | 53 | 571 | 2,266 | |
Civlian Workforce | 931 | 10,070 | 38,181 | |
Military Workforce | 0 | 23 | 66 | |
Total Households | 616 | 6,560 | 25,899 | |
Family Households | 461 | 4,654 | 17,219 | |
Non-Family Households | 155 | 1,905 | 8,679 | |
Married Couple | 405 | 3,641 | 11,777 | |
Other Family | 56 | 1,013 | 5,442 | |
Married w/Child | 185 | 1,287 | 4,474 | |
Single Male w/Child | 1 | 50 | 588 | |
Single Female w/Child | 13 | 347 | 2,142 |
Population Change Last Two Decades - Plus Projection
2000 | % | 2010 | % | 2020 | % | 2030 | |
---|---|---|---|---|---|---|---|
Massachusetts | 6,349,097 | +3 | 6,547,629 | +6 | 6,933,887 | +4 | 7,225,472 |
Bristol County | 534,678 | +3 | 548,285 | +2 | 561,478 | +1 | 567,277 |
Plymouth County | 472,822 | +5 | 494,919 | +5 | 518,508 | +3 | 534,464 |
Total Working Age Population:
Total Households:
Total Working Age Population:
Total Households:
Total Working Age Population:
Total Households: