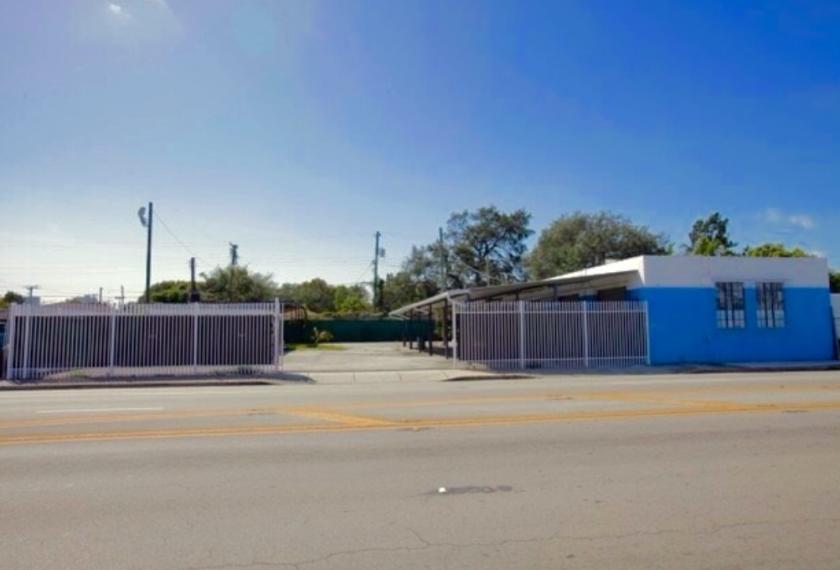
Retail Space
240 Northwest 54th Street Miami, FL 33127
240 Northwest 54th Street Miami, FL 33127
Details & Description
Property Highlights
- • HIGH TRAFFIC COUNT
- • HIGH VISIBILITY
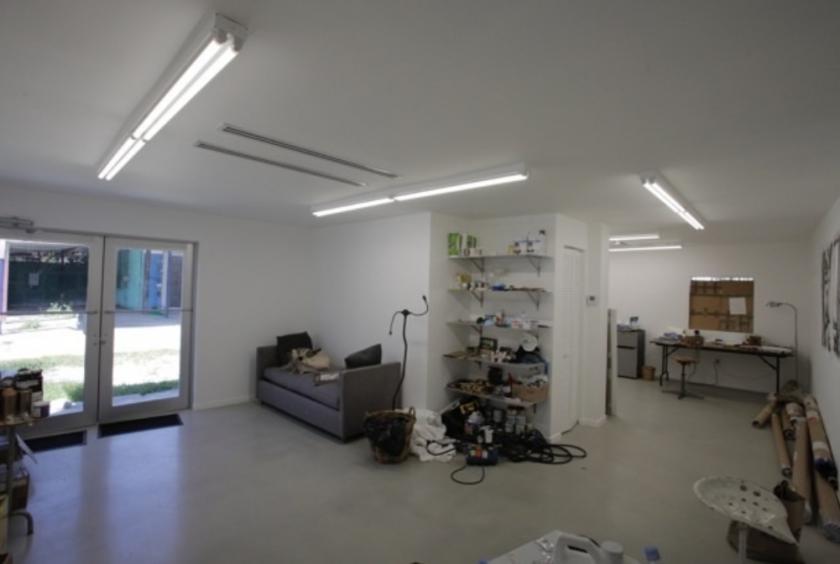
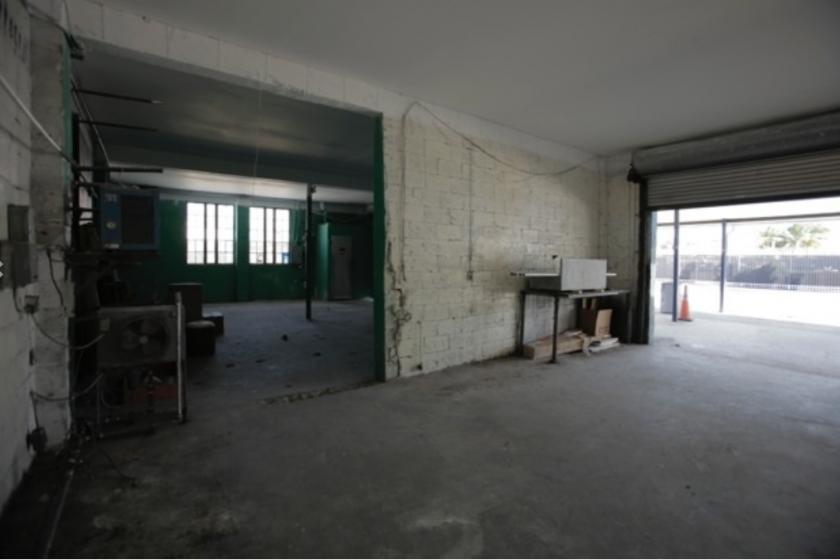
- • GREAT CREATIVE OR RETAIL SPACE
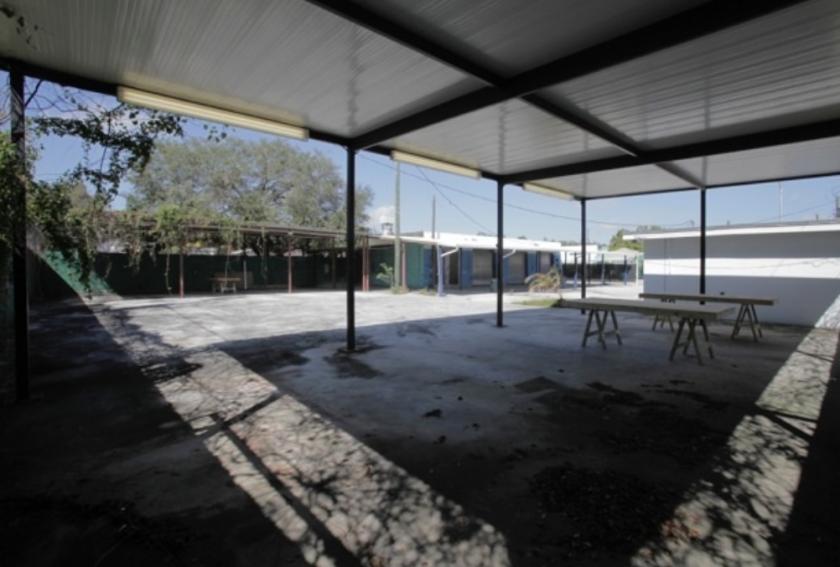
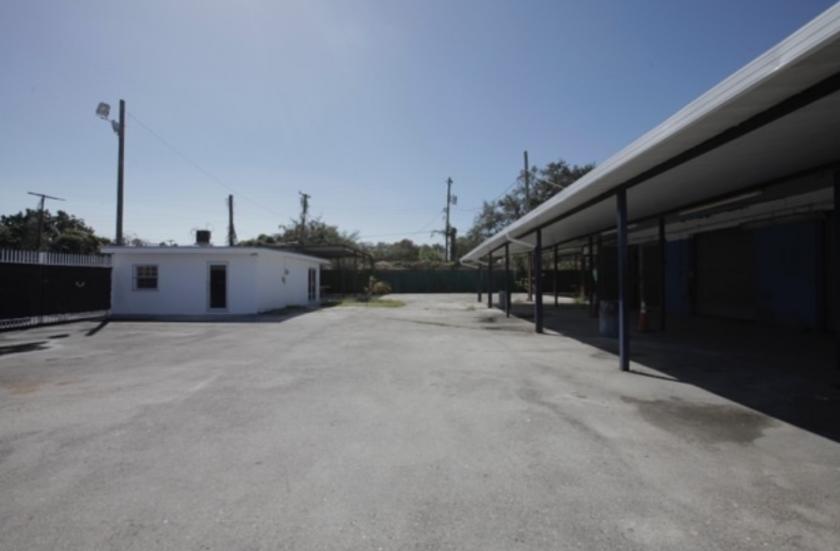
Additional Photos
Listing Agents

Alan Leon
KW Commercial
O: 305-748-7904
alanleon4@gmail.com
KW Commercial
O: 305-748-7904
alanleon4@gmail.com
While we strive to provide the most accurate information, all listing information, and demographic data, is provided by third-parties. As such, MyEListing will not be responsible for the accuracy of the information. It is strongly recommended that you verify all information with the listing agent, and any relevant agencies, prior to making any decisions.


