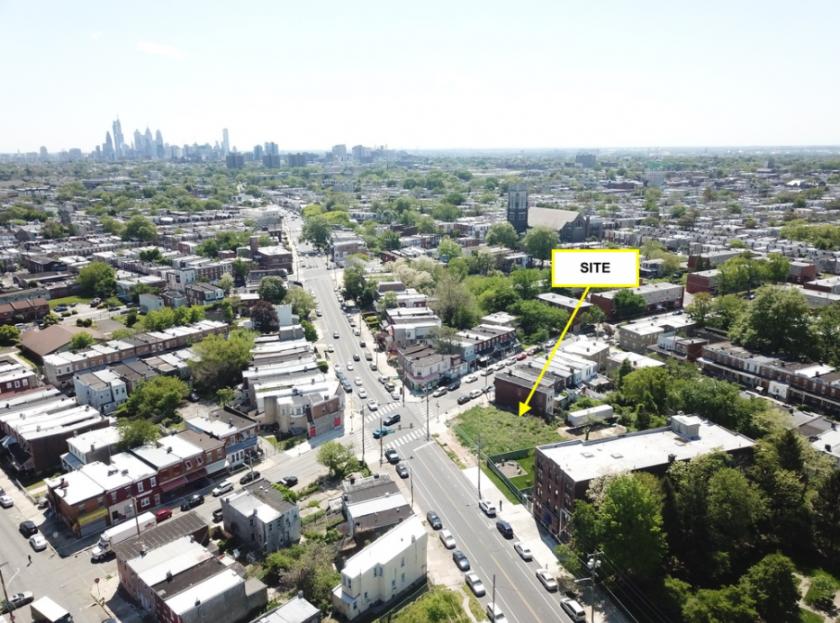
Commercial Land
5500 Haverford Avenue Philadelphia, PA 19139
5500 Haverford Avenue Philadelphia, PA 19139
Details & Description
Property Highlights
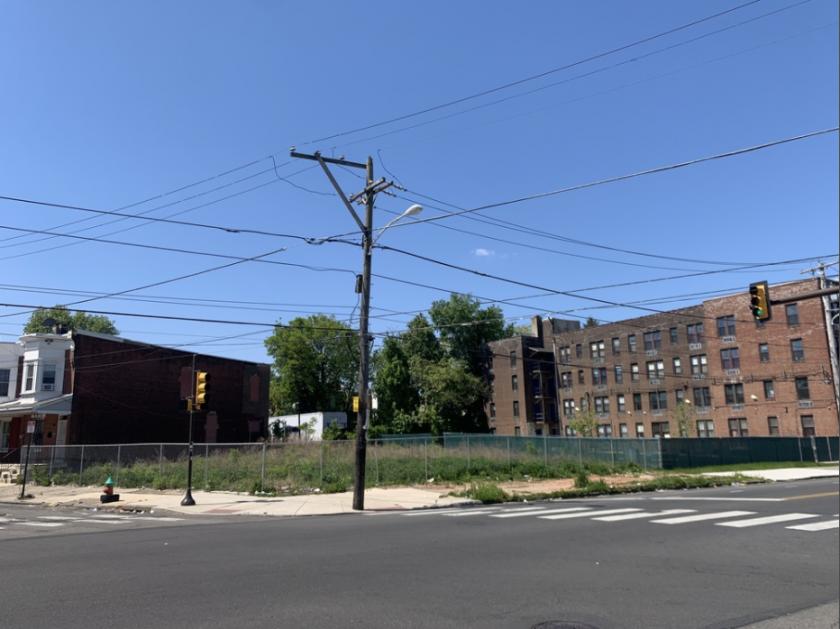
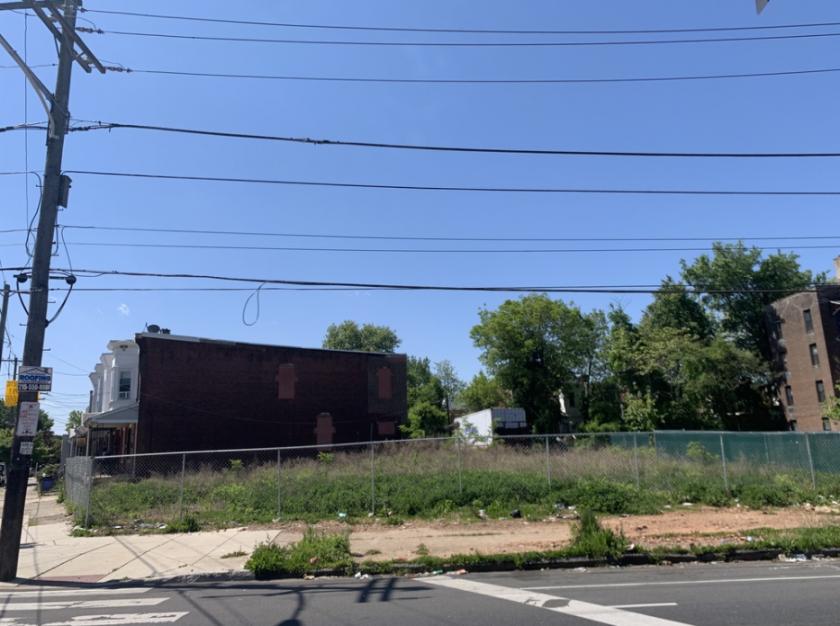
- • Clear and Vacant Lot
- • Signalized Corner Location
- • High demand for rental units
- • Easy access to Center City and i76
Listing Agents

Beau McGettigan
KW Commercial
O: 215-360-3560
M: 484-459-7882
bmack@kwcommercial.com
KW Commercial
O: 215-360-3560
M: 484-459-7882
bmack@kwcommercial.com
While we strive to provide the most accurate information, all listing information, and demographic data, is provided by third-parties. As such, MyEListing will not be responsible for the accuracy of the information. It is strongly recommended that you verify all information with the listing agent, and any relevant agencies, prior to making any decisions.