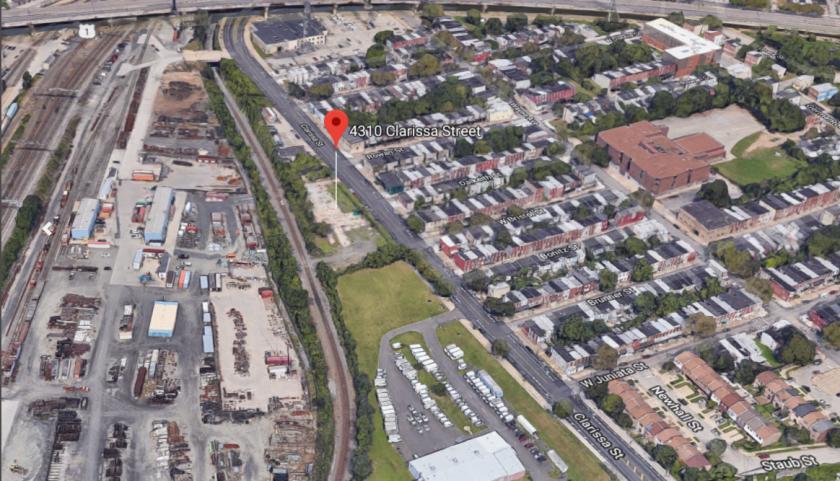
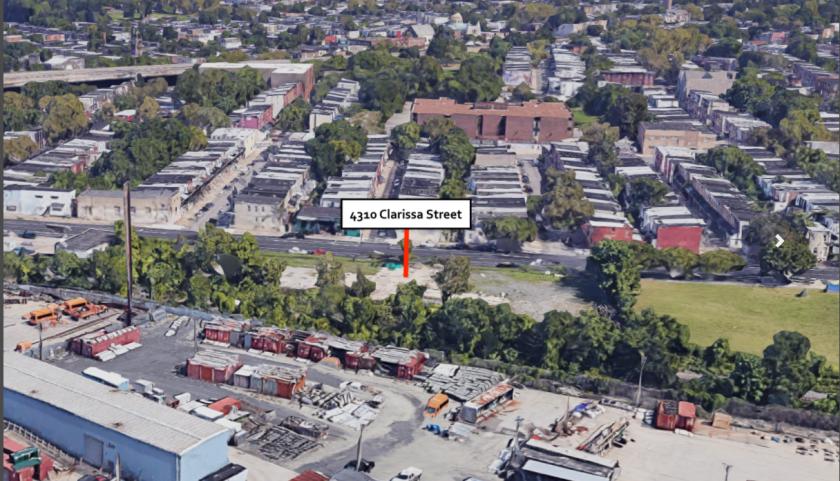
1-Mile | 3-Miles | 5-Miles | ||
---|---|---|---|---|
Total Population | 40,794 | 411,497 | 933,658 | |
Population Median Age | 39 | 36 | 37 | |
Population by Age | 0-9 Yrs | 5349 (13%) | 55840 (13%) | 117078 (12%) |
10-19 Yrs | 5102 (12%) | 58483 (14%) | 121041 (12%) | |
20-29 Yrs | 5981 (14%) | 72327 (17%) | 171937 (18%) | |
30-39 Yrs | 4777 (11%) | 53593 (13%) | 136507 (14%) | |
40-49 Yrs | 5010 (12%) | 45655 (11%) | 104028 (11%) | |
50-59 Yrs | 5545 (13%) | 51803 (12%) | 110526 (11%) | |
60-69 Yrs | 4473 (10%) | 40710 (9%) | 93201 (9%) | |
70+ Yrs | 4557 (11%) | 33084 (8%) | 79338 (8%) | |
Median HH Income | $25,612 | $31,326 | $43,890 | |
Total Household Income | < 24K | 8028 (49%) | 64658 (42%) | 116962 (32%) |
25-49K | 3719 (22%) | 36413 (24%) | 78489 (21%) | |
50-74K | 2151 (13%) | 20258 (13%) | 52608 (14%) | |
75-99K | 1113 (6%) | 12263 (8%) | 35910 (10%) | |
100-199K | 1039 (6%) | 14676 (9%) | 54297 (15%) | |
200K+ | 177 (1%) | 3325 (2%) | 19614 (5%) | |
Highest Education Level | No Diploma | 5140 | 57613 | 100212 |
Diploma or GED | 11361 | 92352 | 187815 | |
Some College | 4962 | 45904 | 101610 | |
Assoc. Degree | 1381 | 14600 | 33853 | |
Bachelors Degree | 2871 | 32003 | 108695 | |
Higher Degree | 1384 | 19606 | 87021 | |
Total Housing Units | 19,691 | 179,093 | 413,035 | |
--Owner-Occupied | 8,139 | 74,268 | 180,374 | |
--Renter-Occupied | 8,087 | 77,324 | 177,507 | |
Owner-Occupied Values | < 100K | 5445 | 38288 | 56355 |
100-199K | 1745 | 22358 | 59492 | |
200-299K | 632 | 8055 | 28483 | |
300-399K | 102 | 2592 | 14319 | |
400-499K | 76 | 1357 | 7114 | |
500K+ | 138 | 1619 | 14611 | |
Total Working Age Population | 32,566 | 323,749 | 749,730 | |
In Work Force | 16,452 | 179,148 | 449,565 | |
Not In Work Force | 16,114 | 144,600 | 300,165 | |
Workforce Employed | 14,256 | 155,971 | 406,019 | |
Workforce Unemployed | 2,196 | 23,072 | 43,264 | |
Civlian Workforce | 16,452 | 179,043 | 449,283 | |
Military Workforce | 0 | 106 | 282 | |
Total Households | 16,226 | 151,593 | 357,881 | |
Family Households | 8,537 | 82,628 | 187,697 | |
Non-Family Households | 7,689 | 68,964 | 170,184 | |
Married Couple | 3,240 | 31,878 | 91,262 | |
Other Family | 5,297 | 50,750 | 96,435 | |
Married w/Child | 930 | 11,266 | 31,628 | |
Single Male w/Child | 407 | 4,213 | 8,745 | |
Single Female w/Child | 2,098 | 20,362 | 39,292 |
Population Change Last Two Decades - Plus Projection
2000 | % | 2010 | % | 2020 | % | 2030 | |
---|---|---|---|---|---|---|---|
New Jersey | 8,414,350 | +4 | 8,791,894 | +4 | 9,132,700 | +4 | 9,530,900 |
Camden County | 508,932 | +1 | 513,657 | 0 | 511,800 | +2 | 521,000 |
Pennsylvania | 12,281,054 | +3 | 12,702,379 | +4 | 13,230,170 | +4 | 13,759,594 |
Bucks County | 597,635 | +5 | 625,249 | +1 | 629,420 | +1 | 637,730 |
Delaware County | 550,864 | +1 | 558,979 | +5 | 588,436 | +6 | 622,307 |
Montgomery County | 750,097 | +7 | 799,874 | +5 | 838,883 | +6 | 891,868 |
Philadelphia County | 1,517,550 | +1 | 1,526,006 | +8 | 1,653,729 | +6 | 1,753,054 |
Total Working Age Population:
Total Households:
Total Working Age Population:
Total Households:
Total Working Age Population:
Total Households: