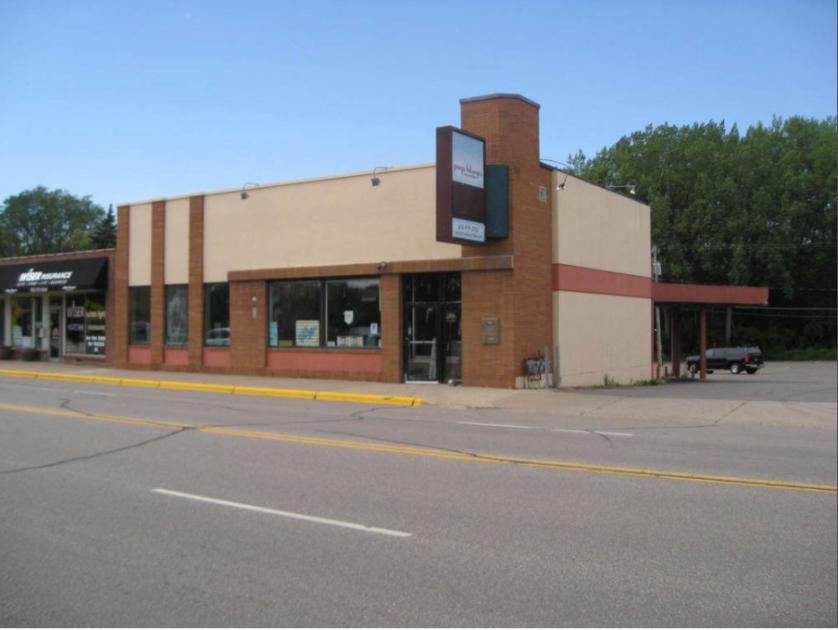
Retail Space
2339 Commerce Boulevard Mound, MN 55364
2339 Commerce Boulevard Mound, MN 55364
Details & Description
Property Highlights
- • Central Business Retail Building for Sale in Mound
- • Great front and side exposure on Blvd
- • Large front windows with lots of light
- • Three large walk-in safes
- • Adjacent to Langdon Lake
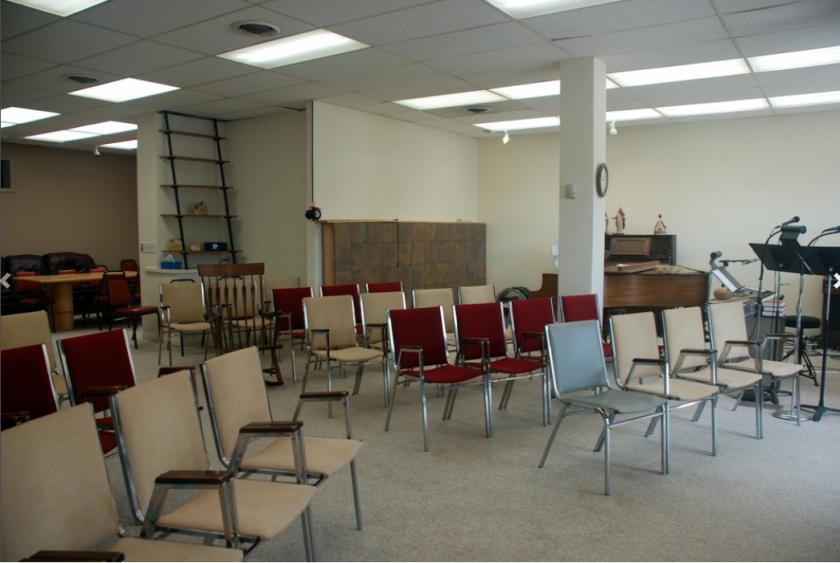
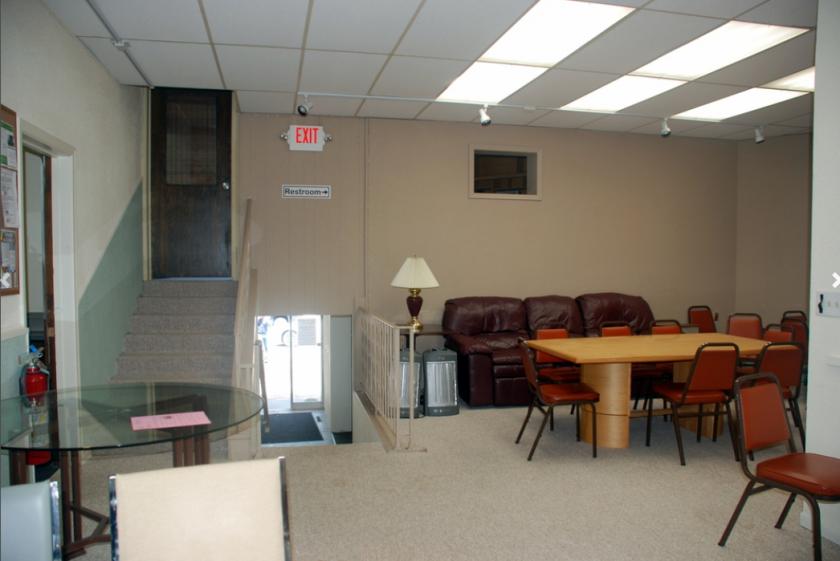
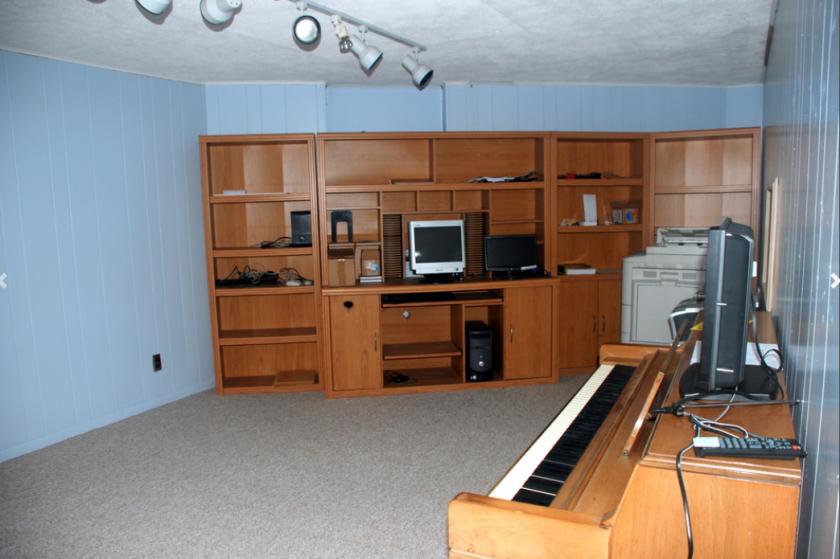
Additional Photos
Listing Agents

Jeffrey Meehan
KW Commercial
O: 612-991-6360
jeff.meehan@kwcommercial.com
KW Commercial
O: 612-991-6360
jeff.meehan@kwcommercial.com
While we strive to provide the most accurate information, all listing information, and demographic data, is provided by third-parties. As such, MyEListing will not be responsible for the accuracy of the information. It is strongly recommended that you verify all information with the listing agent, and any relevant agencies, prior to making any decisions.


