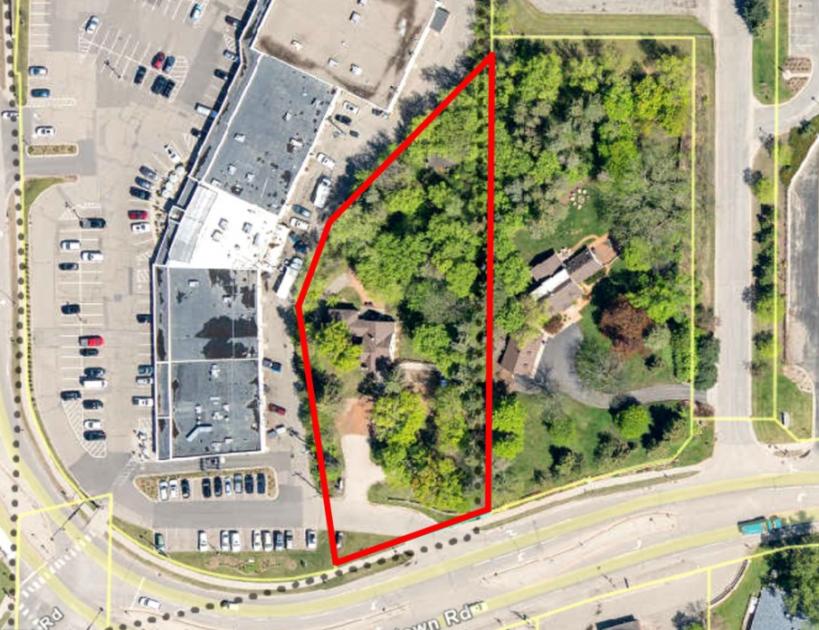
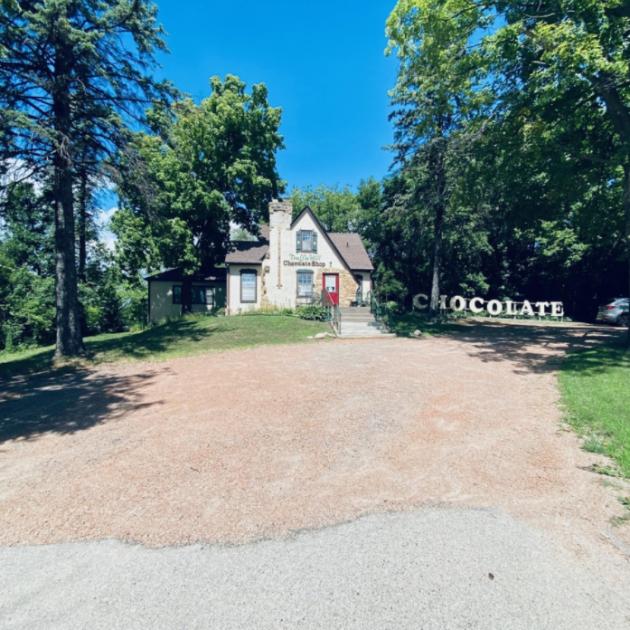
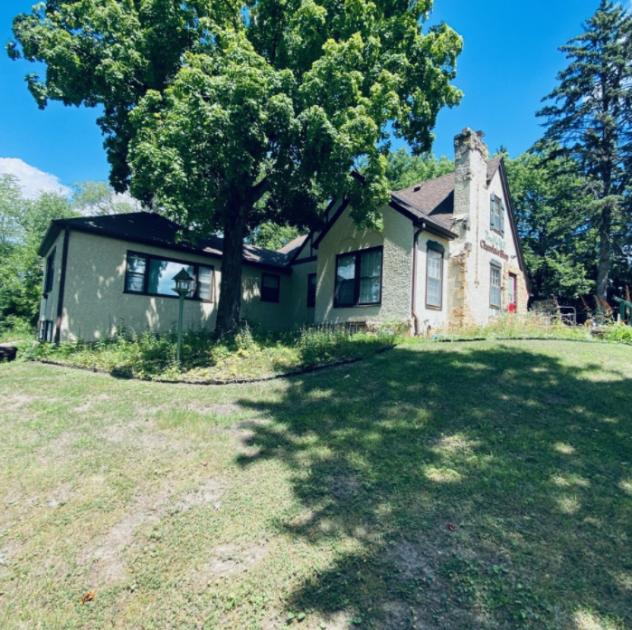
1-Mile | 3-Miles | 5-Miles | ||
---|---|---|---|---|
Total Population | 5,480 | 43,047 | 111,275 | |
Population Median Age | 41 | 42 | 42 | |
Population by Age | 0-9 Yrs | 702 (12%) | 4948 (11%) | 12912 (11%) |
10-19 Yrs | 788 (14%) | 5933 (13%) | 14037 (12%) | |
20-29 Yrs | 366 (6%) | 3120 (7%) | 8975 (8%) | |
30-39 Yrs | 581 (10%) | 4264 (9%) | 12535 (11%) | |
40-49 Yrs | 653 (11%) | 5509 (12%) | 14120 (12%) | |
50-59 Yrs | 1019 (18%) | 8629 (20%) | 21978 (19%) | |
60-69 Yrs | 910 (16%) | 6614 (15%) | 15666 (14%) | |
70+ Yrs | 461 (8%) | 4028 (9%) | 11052 (9%) | |
Median HH Income | $123,896 | $131,433 | $120,142 | |
Total Household Income | < 24K | 189 (8%) | 1476 (8%) | 3809 (8%) |
25-49K | 205 (9%) | 1804 (10%) | 5005 (11%) | |
50-74K | 197 (9%) | 1682 (9%) | 5032 (11%) | |
75-99K | 279 (13%) | 1706 (10%) | 4933 (11%) | |
100-199K | 646 (30%) | 4913 (29%) | 13740 (31%) | |
200K+ | 622 (29%) | 5267 (31%) | 11673 (26%) | |
Highest Education Level | No Diploma | 56 | 550 | 1578 |
Diploma or GED | 546 | 3529 | 10792 | |
Some College | 594 | 4769 | 13342 | |
Assoc. Degree | 293 | 2214 | 6442 | |
Bachelors Degree | 1516 | 12352 | 31203 | |
Higher Degree | 855 | 7068 | 16446 | |
Total Housing Units | 2,323 | 18,212 | 47,322 | |
--Owner-Occupied | 1,656 | 13,593 | 35,363 | |
--Renter-Occupied | 482 | 3,256 | 8,828 | |
Owner-Occupied Values | < 100K | 14 | 183 | 634 |
100-199K | 49 | 753 | 2747 | |
200-299K | 161 | 1291 | 6254 | |
300-399K | 336 | 1996 | 6886 | |
400-499K | 174 | 1769 | 4548 | |
500K+ | 922 | 7601 | 14294 | |
Total Working Age Population | 4,281 | 34,535 | 89,850 | |
In Work Force | 3,033 | 23,850 | 62,515 | |
Not In Work Force | 1,248 | 10,685 | 27,336 | |
Workforce Employed | 2,939 | 22,998 | 60,423 | |
Workforce Unemployed | 94 | 853 | 2,092 | |
Civlian Workforce | 3,033 | 23,850 | 62,515 | |
Military Workforce | 0 | 0 | 0 | |
Total Households | 2,138 | 16,848 | 44,191 | |
Family Households | 1,555 | 12,317 | 31,499 | |
Non-Family Households | 582 | 4,531 | 12,693 | |
Married Couple | 1,381 | 10,999 | 27,812 | |
Other Family | 174 | 1,318 | 3,687 | |
Married w/Child | 597 | 4,416 | 10,999 | |
Single Male w/Child | 52 | 302 | 722 | |
Single Female w/Child | 39 | 430 | 1,314 |
Population Change Last Two Decades - Plus Projection
2000 | % | 2010 | % | 2020 | % | 2030 | |
---|---|---|---|---|---|---|---|
Minnesota | 4,919,479 | +8 | 5,303,925 | +7 | 5,687,161 | +5 | 5,974,304 |
Carver County | 70,205 | +30 | 91,042 | +19 | 107,961 | +14 | 123,156 |
Hennepin County | 1,116,200 | +3 | 1,152,425 | +12 | 1,294,371 | +9 | 1,407,332 |
Total Working Age Population:
Total Households:
Total Working Age Population:
Total Households:
Total Working Age Population:
Total Households: