Downtown St Petersburg Scarcity * Ground Floor Club * Lounge * Venue * Restaurant
Parkside Night Life
Our Offering is for a multi-use hospitality complex on the Park for only $12.00 psf Modified Gross. The Site consists of two floors - the bottom floor is 4,000 sf and the second floor is 2,800 sf. The Site is completely coded, sprinkled and fully fire safety compliant. The space has 5 restrooms, elevator, multiple entrances and exits.
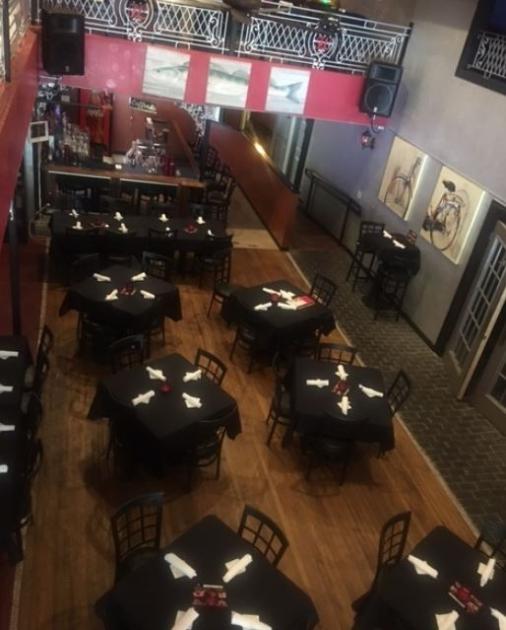
The bottom consists of two entrances - the west door is speakeasy-like that leads to private rooms. The east entrance has a covered walkway, the front door leads to a grand entryway with a full-service bar to the right. The floor open up to a dining room or dance floor. To the left there is private dining rooms or VIP suites. To the rear, there is yet another full-service bar and also a large kitchen.
The Building is perfect for multiple uses such as a Retail Store * Restaurant * Night Club / Lounge * Concert Venue * Retail Medical * Gallery * Office * Brewery / Tasting Room * Dept Store / Giant Retail * Med Spa * Fitness Center * Salon. The Site consists of two floors - the bottom floor is 4,000 sf and the second floor is 2,800 sf.
The Site is currently build out as a restaurant and may stay as one or may be re-configured for "Any" other use. The following are the details for the Site remaining as a Restaurant.
"Large Restaurant / Entertainment Venue" available for Lease. This is a Sub-Lease on a very Long Term Lease. The space is full blown turn-key brand new equipped operation. All the Work has been done for you. The Build Out, the permits,the certifications, fixtures are all in place and all can be conveyed. The Kitchen includes brand new Hood * Grease Trap * Stove Top * Ovens * Walk-In Cooler (please see the complete Equipment & Fixtures List). The Site also boasts of Valet Parking (hard to obtain in downtown) * Cafe Seating for 24 + with Cafe Permit * Dog Friendly Cafe Seating with Permit * SRX Liquor License with a Full Bar * Brand New POS system * Two floors * Four New Restrooms. Bottom Floor consists of Main Bar fully equipped with several new drinks wells with new Soda System. The main Dining floor is on this first floor and transform into a dance floor in the late evenings. The bottom floor also features another new full bar - two private dining rooms/VIP.
Tampa Bay is the second largest MSA in the South and 13th largest MSA in the nation. St. Petersburg has a higher average household income than Miami, Orlando or Tampa. It has the greatest number of households with a net worth in excess of $1 million in the Tampa Bay area.
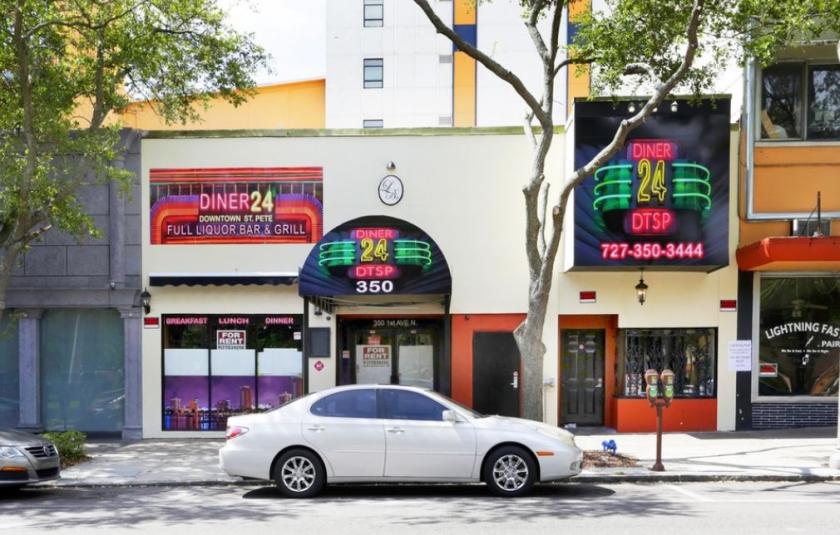
LOCATION DESCRIPTION: The Site is located on First Ave North between 3rd Street North & 4th Street North in heart of Downtown St Petersburg - which is considered One of the Best Thriving Downtowns in the Southeast - at 350 First venue North.
The Restaurant sits on 1st Ave North which is thee Main East to West corridor with 11,000 cars per day and also is near the cross street of 4th Street North which is considered St Pete's Most Popular North/South prosperous boulevard with another 11,000 cars.
The proximity of the Venue is excellent - next to the Jannus Landing Block - 3 blocks to the waterfront and Beach Drive / also walking distance to the new Pier, the 600 Indie Block and The Edge