Say It Aint So > Retail Space Available on the 400 Block of Central
Could Not Get Any Better - Downtown Central Avenue St Petersburg - Retail, Restaurant, Office Opportunity
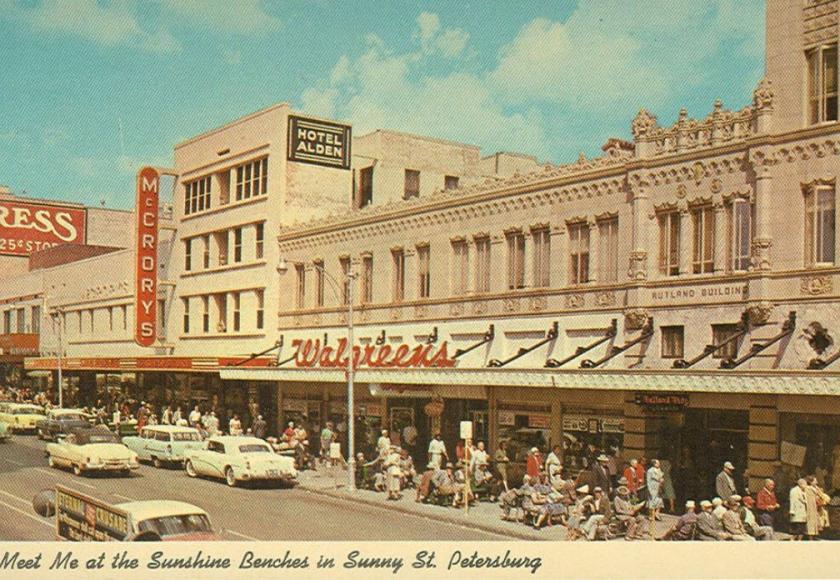
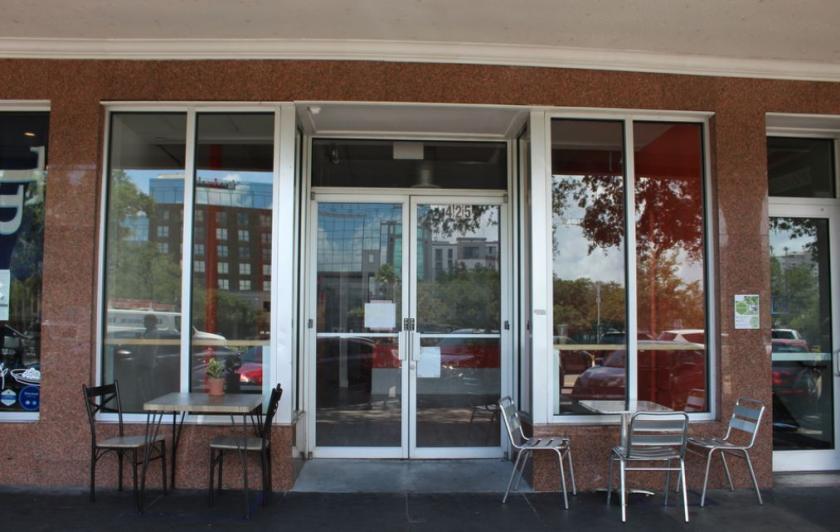
This is a Ground Floor / Street Frontage Space available in the famous and historic McCroy Building. This Site is on MAIN & MAIN being that it is on Central Avenue and 4th Street North. Recently, the space was the Chicken & Cone location. Consequently, making it a newer second-generation cafe. There is no hood but one could be installed
The Site boasts the best of the best outside areas with a giant double-wide sidewalk cafe.
This Space may be used for Restaurant, Retail, or Office.
The site is perfect for many types of Retail like a Cafe, Med Spa, Gallery, Salon, Gift Shop, Coffee shop, Deli, and any other soft food& beverage uses. The Site may also be used for those seeking a street-level office presence, such as Insurance firms, Real Estate Offices, Financial Companies, Sales Offices, Urgent Care Centers or other medical uses. A prime for a National Franchise, as well.
The Walkability is high - a full 97% - most weekend evenings over 300 people per hour walk by - put your sign out and grab the business.
But let me repeat 1) Commercial Space in Downtown St Petersburg 2) Ground Floor Retail 3) On Central Avenue 4) Off of the Intersection at 4th Street 5) Historic McCrory's Building 6) Potential Restaurant Site
$50.000/NNN
Location Description: Simply a superb location - The address is 433 Central which is on the northside the 400 block of Central Avenue between 4th Street North and 5th Street North.
The 429 Central translates to a Central Avenue and 4th Street North address, two of the most well know corridors in St Pete. 4th Street is considered St Pete's most popular commercial highway and Central Avenue is St Pete's Main Street. The Site is in the 400 Block Dining District which is across the street from one of St Pete's largest developments - New Towers form the Big Apple Development Group featuring the Marriott Hotel.
The Address is the middle of all the key districts of Downtown - walking distance to Beach Drive, the Jannus Block, 600 Block Shopping & Dining District, and the Edge.
The Site is only 1 minute from the Interstate, 7 minutes from the Beaches, 10 minutes to the Skyway Bridge, 15 minutes to Tampa.
The location is only minutes from many of St Pete's key neighborhoods such Old Northeast, Snell Isle, Uptown, Kenwood, Shore Acres, Old Southeast, Tropical Shores, Coquina Key, Driftwood, Pink Streets, St Paul-Euclid, and Allendale
PLEASE DO NOT DISTURB CURRENT TENANTS - APPOINTMENTS ONLY.
Contact Jon Reno La Budde @ 727-510-1921