Commercial Land
35960 Arendt Lane Murrieta, CA 92563
35960 Arendt Lane Murrieta, CA 92563
Details & Description
Property Highlights
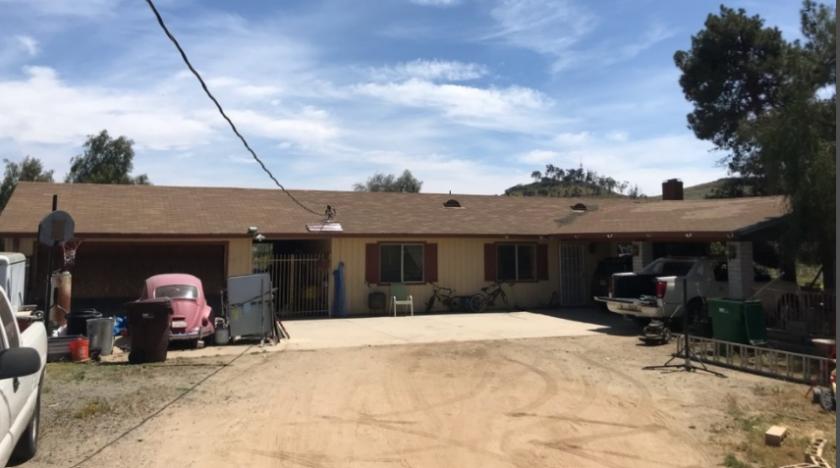
• SFR for up to 10 units per acre.This listing is in the SFR Single Family Development area.
• 35960 Arendt Ln Murrieta City approved Single Family Development 1-10unitsAcre.
Listing Agents

Bret Major
KW Commercial
O: 858-220-5311
M: 858-220-5311
bretmajor@kw.com
KW Commercial
O: 858-220-5311
M: 858-220-5311
bretmajor@kw.com

Lou Lollio
KW Commercial
O: 760-659-0305
M: 310-293-9860
loulollio@kw.com
KW Commercial
O: 760-659-0305
M: 310-293-9860
loulollio@kw.com
While we strive to provide the most accurate information, all listing information, and demographic data, is provided by third-parties. As such, MyEListing will not be responsible for the accuracy of the information. It is strongly recommended that you verify all information with the listing agent, and any relevant agencies, prior to making any decisions.