THIS IS THE #1 LOCATION IN ALL OF ST PETERSBURG - 201 Central Avenue Downtown St Petersburg
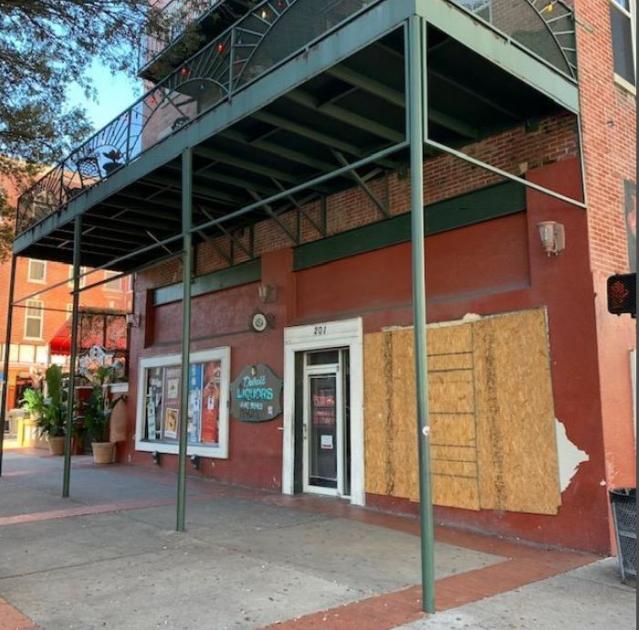
This hard corner at Central Avenue and 2nd Street North is now available for the first time in 20 years. Picture your business, your concept, your cafe, your store, your bar, your salon, your gallery at "thee" best location in St Petersburg.
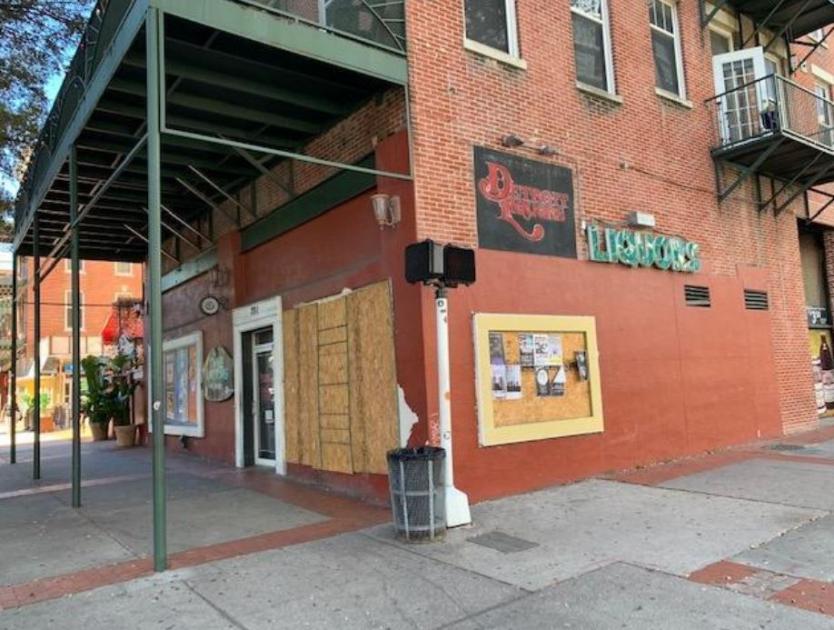
This is a Ground Floor / Street Frontage Space available in the famous and historic Detroit Hotel. The Detroit Hotel is one of the city's oldest and most famous structures. This Site is on MAIN & MAIN being that it is on Central Avenue and 2nd Street North. Anyone that is downtown is mostly going to this corner or walking by. St Pete's First Friday is a nationally known event and is held at this corner. Revenues from First Friday alone has been known to pay your Rent twice over. Think about the possibility of your Rent being paid in one-half of that single day, leaving 29 days plus to make money.
The current floor plan has a is an open area with two rooms separated by archways with a proposed ADA restroom. Total interior square footage is 1090 and total square footage outside is 1900.
The Site boasts of original floor to ceiling openings, real historic brick interior walls, the largest and best sidewalk cafe, Walkability Rating of 100% and the best zoning in town DC-C.
The People Traffic on weekends rivals that of Lincoln Road in South Beach Miami. On any given weekend day or night people, counts have been as high 4700 people per hour.
This Space seems to be best suited for some type of hospitality such as a Corner Bar, Cafe, Deli, Coffee and more. The Site is also suitable for a retail operation, gallery, salon, gift shop, spa and more. The Site may also be used for those seeking a street-level presence, such as Insurance firms, Real Estate Offices, Financial Companies, Sales Offices, Urgent Care Centers or more. The Site also Prime for a National Franchise
But let me repeat 1) Commercial Space in Downtown St Petersburg 2) Ground Floor Retail 3) On the best corner in St Pete 4) On Central Avenue 5) On the Jannus Landing Block 6) On Intersection at 2nd Street 7) In the historic Detroit Hotel
Please call Joe Esposito 941-212-2222 or Jon La Budde 727-510-1921