One of the Best Locations in Downtown St Petersburg is Now Available
658 Central Avenue
Imagine "your" next concept, your bar, your cafe, your nail salon, your boutique, your gym, your salon, your gallery, your gift shop, your pub or your spa at this top tier location in St Petersburg.
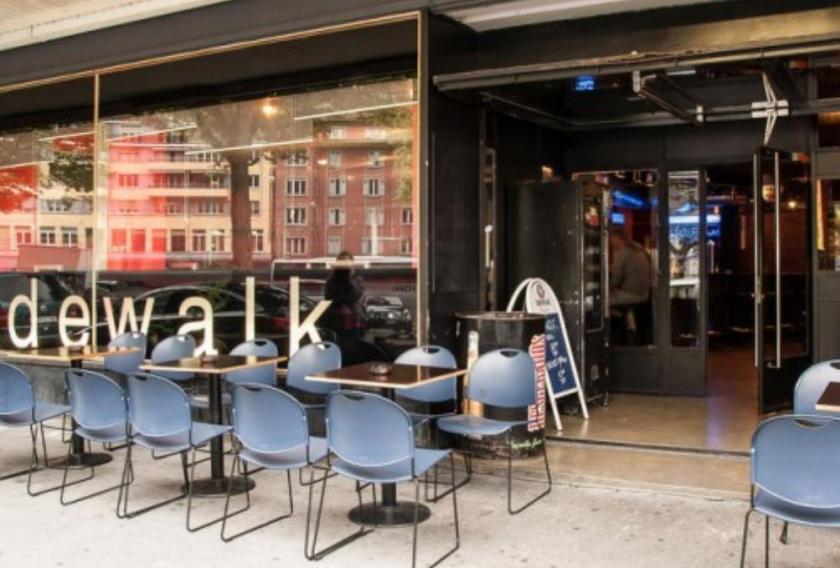
This is a Ground Floor / Street Frontage Space available in the popular 600 Block Indie Shopping & Dining District. The 600 Block is well known for its mixed-use landscape, featuring local and eclectic shopping and dining complemented by the best in edgy national concepts.
In addition, the historic State Theater is undergoing a major renovation and beautification projection. The resulting Spring reopening will have a tremendous impact on this particular site and the co-tenants. The State expects to host over 150 shows per year resulting in a significant surge in business for all surrounding business neighbors.
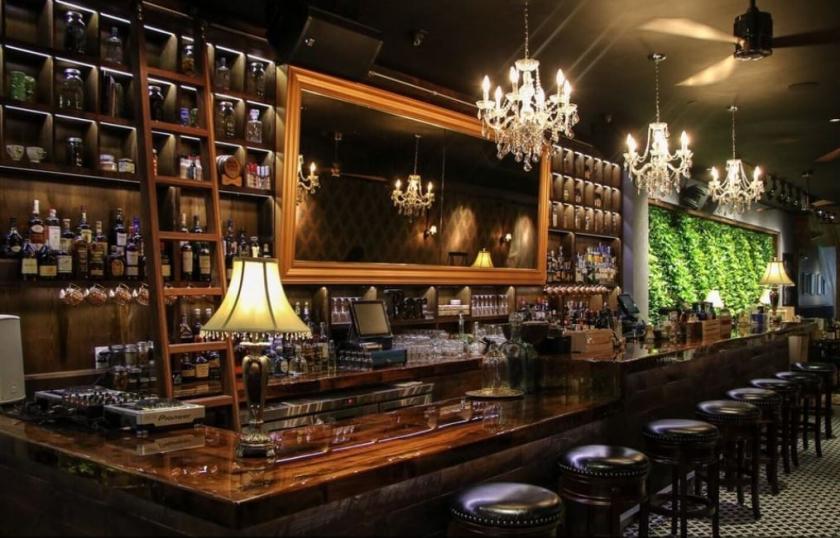
The space size is 1.900 sf, and formerly housed a bar. Currently, the space has been gutted resulting in 14 foot exposed ceilings and the original 1920's flagstone flooring. There is a front sidewalk cafe, large retail windows and a potential for a front roll-up door.
The Walkability factor is high on this part of Central Avenue. This District is the new upcoming epic center of downtown St Petersburg - being between the new Related Towers Development "ICON" and the newly proposed towers by Red Apple.
But let me repeat 1) Commercial Space in Downtown St Petersburg 2) Ground Floor Retail 3) One of the best blocks in St Pete 4) On Central Avenue 5) In the 600 Block Shopping & Dining District 6) Surrounded by a critical mass of downtown residents.
SOME pictures attached to this Listing are STOCK PHOTOS and may not be an actual photo of Site.
Please Note: This could be a destination concept, in a destination district, in a destination downtown, in a destination city, in a destination state.
Location Description: The Site is located on 600 Block of Central Avenue at 658 Central Avenue.
This Location is in the core of downtown - two-minute walking distance to Jannus Live Block to the east and 2 minutes to west for The Edge District. Five minutes to the east to Beach Drive and 5 minutes to the west to the Grand Central Shopping & Dining District.
The Address is on the south side of the Avenue between 6th Street North and 7th Street North. The 600 Block is now considered one of the new centers of Downtown.
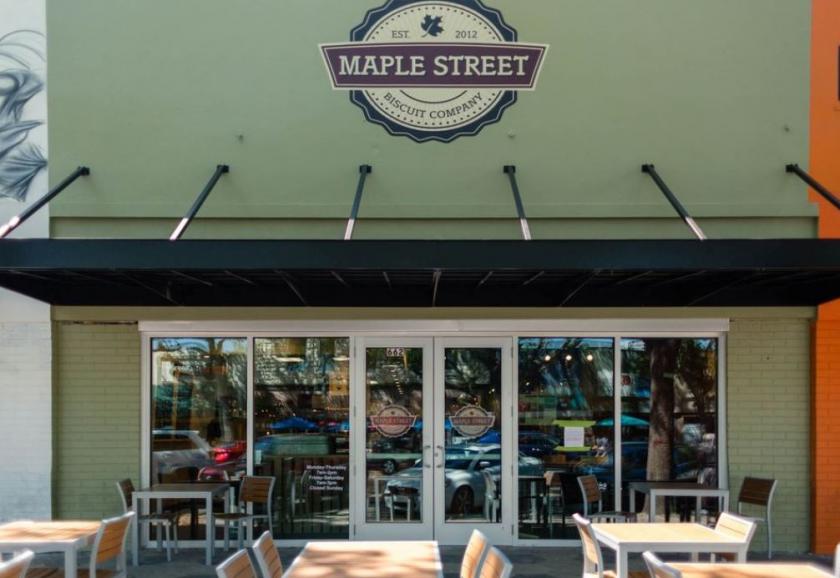
The District is surrounded by thousands of new downtown residents - Hermatige, Bainbridge, Beacon 430, AER, Fusion and more. The District boasts of numerous stellar co-tenants like Hopdoddy, Pacific Counter, Maple Street Biscuit Company, The Lure, Amigos, State Theater, Publix, Chilluly, Misred and more.