Your Dream is Now a Reality * Start your Own Salon
Dollylocks Salon is Available for Lease
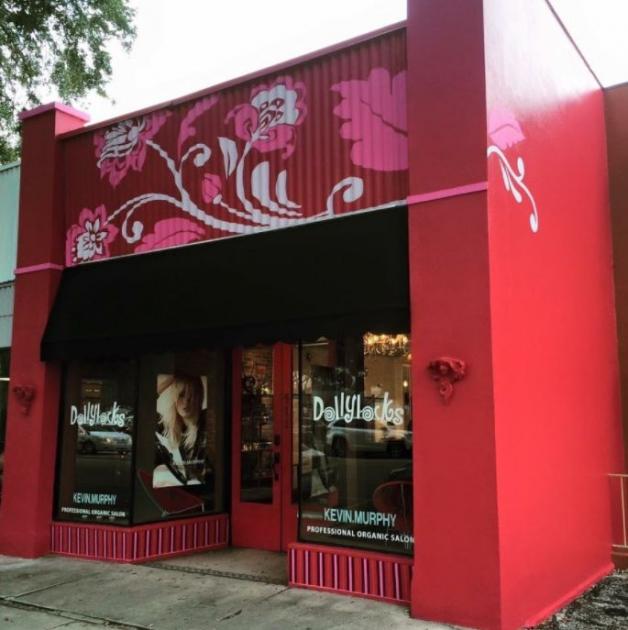
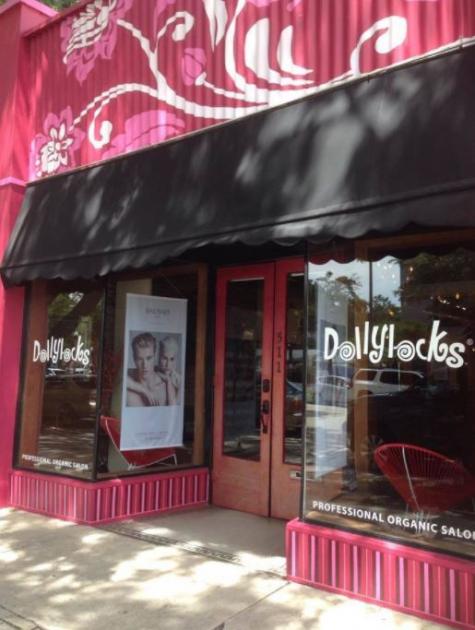
Our Offering is a for turn-key, ready-to-go, very attractive hair salon of 2,411 sf. space for lease, The design and layout are stunning, consisting of a reception escritoire and comfortable lobby area, large open styling area with 9 stations, shampoo section, decorated restrooms, color room, and a sizable backroom.
The storefront could not be more gorgeous, with great sign exposure, and rare on-site parking.
Location, Location, Location, we hate to say it but its true. The location is popular and super convenient. The Salon actually sits on the border of The Edge Shopping & Dining District of Downtown and the famous historic Uptown Business District and Neighborhood. Plus the salon is only a few feet from a major lighted intersection that is the gateway to the Interstate, which is 1/2 block away. This intersection boasts of over 32,000 cars per day.
Location Description: Simply a stellar location. The Site is located on Dr. MLK St North on the 500 block at 511. The address is also known as 511 9th Street North.
The address is just off one of the main lighted intersections in St Petersburg, that being 5th Avenue North and Dr. Martin Luther King Street North. 5th Avenue North is a major east/west corridor with a superior traffic count of 13,000 vehicles per day. Dr. MLK St N. is one of the important north/south arteries of St Petersburg with a traffic count of over 19,000 vehicles per day.
The entrance and exit to the Interstate are less than one block away.
The Site is only one-minute to Downtown and all the cool districts like The Edge, 600 Block, Grand Central, Jannus Landing, and Beach Drive.
The Address is only minutes from numerous popular neighborhoods in St Pete such as Uptown, Woodlawn, St Paul - Euclid, Cresent Heights, Allendale, Old Northeast, and Snell Isle.
Being only one block from the Interstate makes Tampa and the Beaches only 11 to 15 minutes away.
Please consider contacting lead associate JonnY RenO La Budde * 727-510-1921