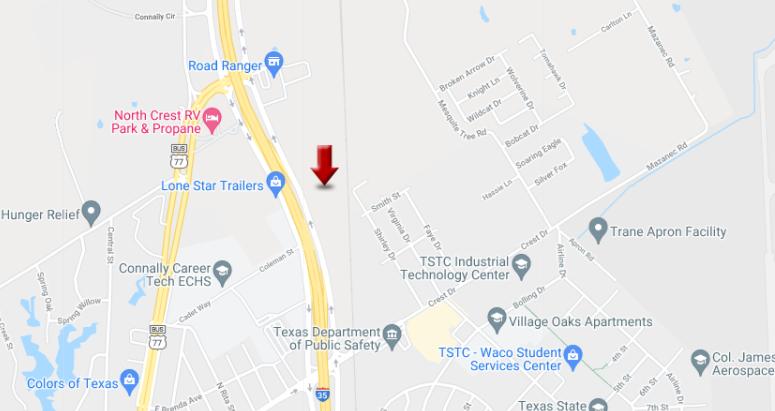
1-Mile | 3-Miles | 5-Miles | ||
---|---|---|---|---|
Total Population | 2,516 | 15,836 | 31,859 | |
Population Median Age | 34 | 34 | 35 | |
Population by Age | 0-9 Yrs | 329 (13%) | 2465 (15%) | 4921 (15%) |
10-19 Yrs | 436 (17%) | 2493 (15%) | 5120 (16%) | |
20-29 Yrs | 557 (22%) | 3094 (19%) | 5267 (16%) | |
30-39 Yrs | 309 (12%) | 1886 (11%) | 3846 (12%) | |
40-49 Yrs | 218 (8%) | 1505 (9%) | 3594 (11%) | |
50-59 Yrs | 219 (8%) | 1677 (10%) | 3296 (10%) | |
60-69 Yrs | 235 (9%) | 1569 (9%) | 3374 (10%) | |
70+ Yrs | 212 (8%) | 1147 (7%) | 2441 (7%) | |
Median HH Income | $40,849 | $40,603 | $40,648 | |
Total Household Income | < 24K | 250 (29%) | 1690 (30%) | 3453 (31%) |
25-49K | 269 (31%) | 1729 (31%) | 3280 (29%) | |
50-74K | 146 (17%) | 848 (15%) | 1887 (17%) | |
75-99K | 112 (13%) | 636 (11%) | 1212 (10%) | |
100-199K | 70 (8%) | 519 (9%) | 1130 (10%) | |
200K+ | 11 (1%) | 34 (0%) | 104 (0%) | |
Highest Education Level | No Diploma | 206 | 1803 | 3905 |
Diploma or GED | 373 | 2584 | 5551 | |
Some College | 414 | 2437 | 4626 | |
Assoc. Degree | 263 | 1209 | 2125 | |
Bachelors Degree | 100 | 669 | 1675 | |
Higher Degree | 56 | 296 | 725 | |
Total Housing Units | 1,074 | 6,484 | 12,881 | |
--Owner-Occupied | 491 | 2,701 | 6,009 | |
--Renter-Occupied | 367 | 2,755 | 5,056 | |
Owner-Occupied Values | < 100K | 270 | 1528 | 3331 |
100-199K | 182 | 912 | 1886 | |
200-299K | 36 | 194 | 513 | |
300-399K | 3 | 27 | 56 | |
400-499K | 0 | 9 | 70 | |
500K+ | 0 | 32 | 153 | |
Total Working Age Population | 1,990 | 12,264 | 24,250 | |
In Work Force | 1,148 | 7,014 | 13,750 | |
Not In Work Force | 841 | 5,250 | 10,500 | |
Workforce Employed | 1,051 | 6,584 | 13,031 | |
Workforce Unemployed | 77 | 394 | 684 | |
Civlian Workforce | 1,128 | 6,979 | 13,715 | |
Military Workforce | 20 | 35 | 35 | |
Total Households | 858 | 5,456 | 11,065 | |
Family Households | 553 | 3,632 | 7,475 | |
Non-Family Households | 304 | 1,824 | 3,590 | |
Married Couple | 356 | 2,191 | 4,351 | |
Other Family | 198 | 1,441 | 3,124 | |
Married w/Child | 116 | 720 | 1,518 | |
Single Male w/Child | 10 | 207 | 386 | |
Single Female w/Child | 71 | 608 | 1,361 |
Population Change Last Two Decades - Plus Projection
2000 | % | 2010 | % | 2020 | % | 2030 | |
---|---|---|---|---|---|---|---|
Texas | 20,851,820 | +21 | 25,145,561 | +18 | 29,677,668 | +18 | 34,894,452 |
Hill County | 32,321 | +9 | 35,089 | +2 | 35,673 | -2 | 35,119 |
McLennan County | 213,517 | +10 | 234,906 | +8 | 253,066 | +6 | 269,381 |
Total Working Age Population:
Total Households:
Total Working Age Population:
Total Households:
Total Working Age Population:
Total Households: