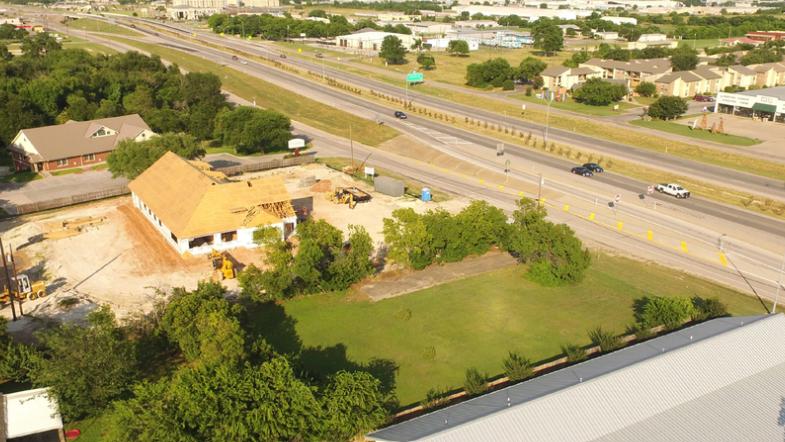
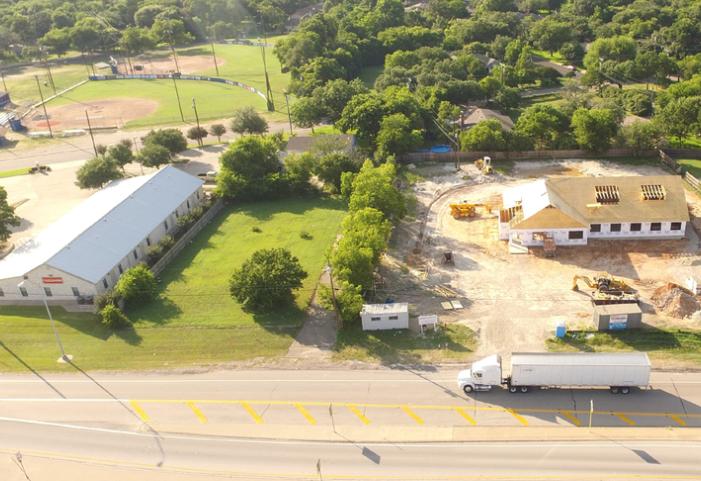
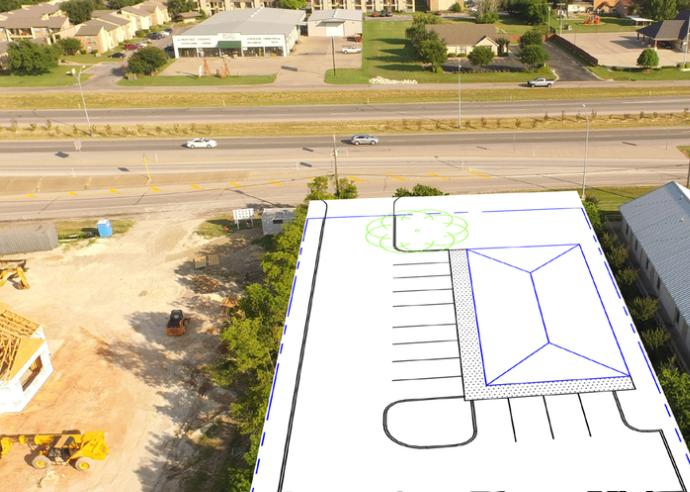
1-Mile | 3-Miles | 5-Miles | ||
---|---|---|---|---|
Total Population | 4,563 | 42,226 | 103,863 | |
Population Median Age | 44 | 41 | 38 | |
Population by Age | 0-9 Yrs | 565 (12%) | 5155 (12%) | 14195 (13%) |
10-19 Yrs | 492 (10%) | 4923 (11%) | 13639 (13%) | |
20-29 Yrs | 456 (9%) | 5827 (13%) | 15002 (14%) | |
30-39 Yrs | 550 (12%) | 5771 (13%) | 13687 (13%) | |
40-49 Yrs | 385 (8%) | 4282 (10%) | 10962 (10%) | |
50-59 Yrs | 467 (10%) | 5117 (12%) | 12444 (11%) | |
60-69 Yrs | 675 (14%) | 4934 (11%) | 11236 (10%) | |
70+ Yrs | 972 (21%) | 6216 (14%) | 12698 (12%) | |
Median HH Income | $74,897 | $57,626 | $53,678 | |
Total Household Income | < 24K | 239 (13%) | 3349 (19%) | 8418 (21%) |
25-49K | 329 (18%) | 3967 (23%) | 10147 (25%) | |
50-74K | 340 (18%) | 3534 (20%) | 7325 (18%) | |
75-99K | 385 (21%) | 2205 (12%) | 4626 (11%) | |
100-199K | 440 (24%) | 3351 (19%) | 7212 (18%) | |
200K+ | 79 (4%) | 793 (4%) | 1962 (4%) | |
Highest Education Level | No Diploma | 199 | 2798 | 9996 |
Diploma or GED | 450 | 6219 | 15652 | |
Some College | 944 | 7216 | 15516 | |
Assoc. Degree | 328 | 3188 | 6683 | |
Bachelors Degree | 973 | 6329 | 13061 | |
Higher Degree | 436 | 3603 | 7898 | |
Total Housing Units | 1,929 | 18,608 | 43,260 | |
--Owner-Occupied | 1,253 | 9,732 | 24,128 | |
--Renter-Occupied | 559 | 7,467 | 15,562 | |
Owner-Occupied Values | < 100K | 26 | 1450 | 6705 |
100-199K | 682 | 4600 | 9677 | |
200-299K | 468 | 2545 | 4959 | |
300-399K | 51 | 530 | 1418 | |
400-499K | 20 | 211 | 550 | |
500K+ | 6 | 396 | 819 | |
Total Working Age Population | 3,655 | 33,995 | 81,163 | |
In Work Force | 2,026 | 22,063 | 51,659 | |
Not In Work Force | 1,629 | 11,932 | 29,504 | |
Workforce Employed | 1,970 | 21,280 | 49,866 | |
Workforce Unemployed | 56 | 759 | 1,727 | |
Civlian Workforce | 2,026 | 22,040 | 51,593 | |
Military Workforce | 0 | 24 | 66 | |
Total Households | 1,812 | 17,200 | 39,690 | |
Family Households | 1,267 | 10,994 | 26,370 | |
Non-Family Households | 544 | 6,205 | 13,320 | |
Married Couple | 1,035 | 7,625 | 18,813 | |
Other Family | 232 | 3,369 | 7,557 | |
Married w/Child | 350 | 2,495 | 6,914 | |
Single Male w/Child | 18 | 268 | 826 | |
Single Female w/Child | 119 | 1,531 | 3,238 |
Population Change Last Two Decades - Plus Projection
2000 | % | 2010 | % | 2020 | % | 2030 | |
---|---|---|---|---|---|---|---|
Texas | 20,851,820 | +21 | 25,145,561 | +18 | 29,677,668 | +18 | 34,894,452 |
Falls County | 18,576 | -4 | 17,866 | -7 | 16,603 | -6 | 15,663 |
McLennan County | 213,517 | +10 | 234,906 | +8 | 253,066 | +6 | 269,381 |
Total Working Age Population:
Total Households:
Total Working Age Population:
Total Households:
Total Working Age Population:
Total Households: