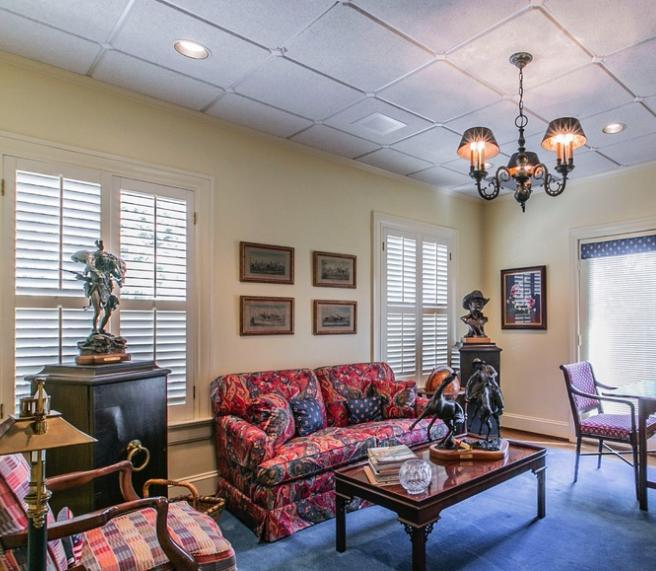
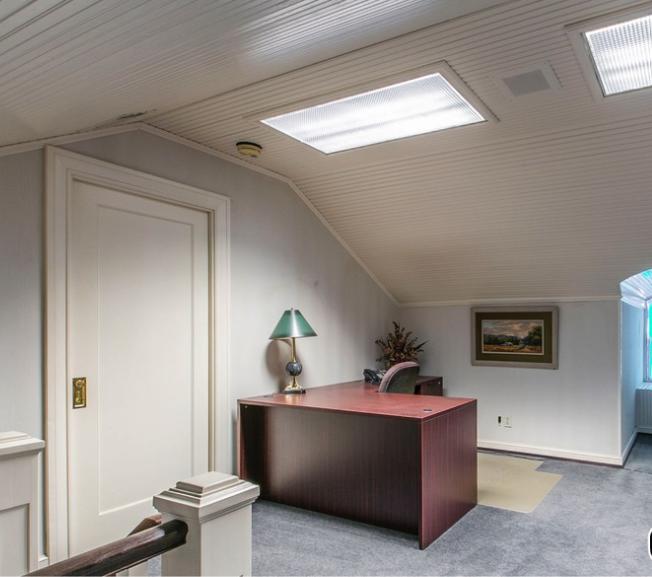
Office Space
2524 Austin Avenue Waco, TX 76710
2524 Austin Avenue Waco, TX 76710
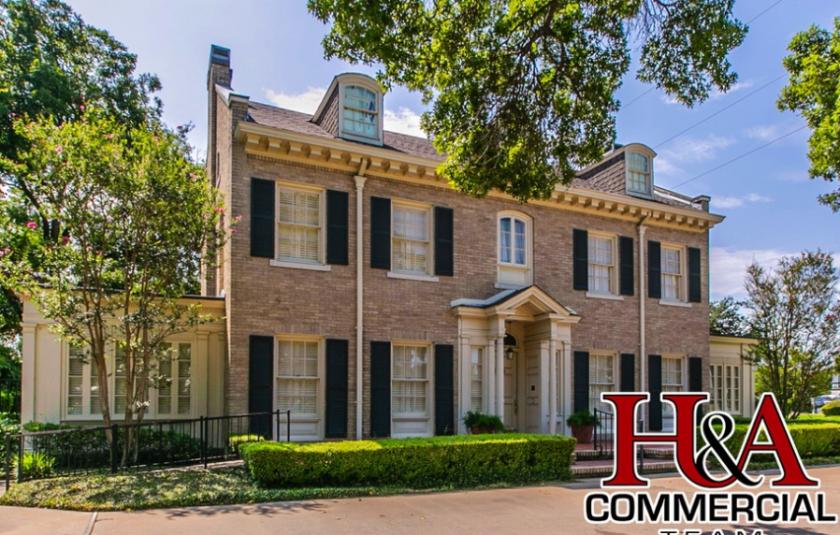
Details & Description
Property Highlights
- • Year Built 1921
- • Austin Avenue Frontage 100
- • Easily Accessible
- • Total Improvements 5,518 SF
- • Zoned Wacos O-2 Office-Residence District
Listing Agents

Brad Harrell
O: 254-265-7220
M: 254-749-7551
commercial@harrellteam.realestate
O: 254-265-7220
M: 254-749-7551
commercial@harrellteam.realestate
While we strive to provide the most accurate information, all listing information, and demographic data, is provided by third-parties. As such, MyEListing will not be responsible for the accuracy of the information. It is strongly recommended that you verify all information with the listing agent, and any relevant agencies, prior to making any decisions.