Industrial Properties
400 Broadway Freehold, NJ 07728
400 Broadway Freehold, NJ 07728
Details & Description
Property Highlights
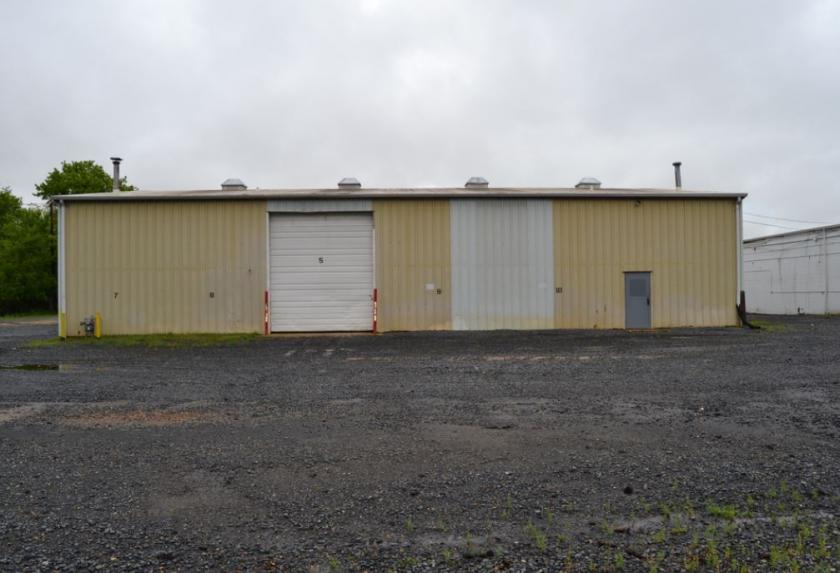
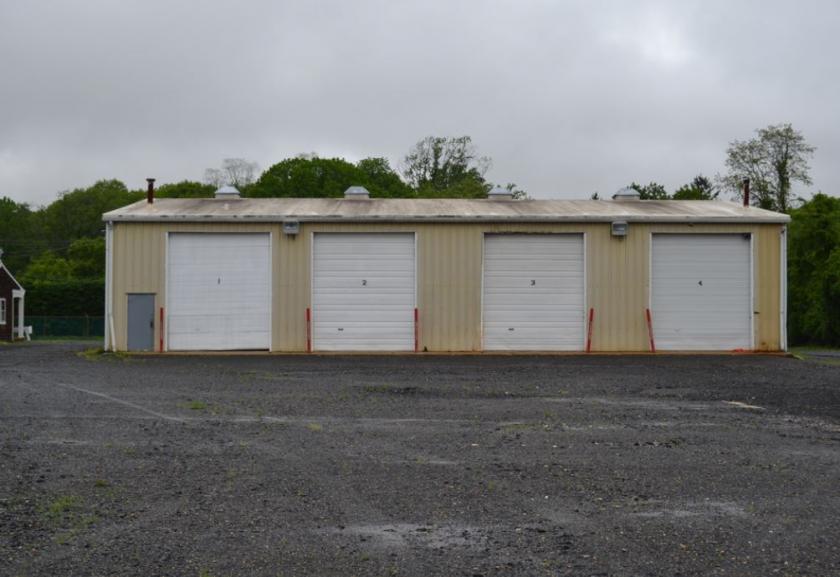
- • 60 X 80 foot building
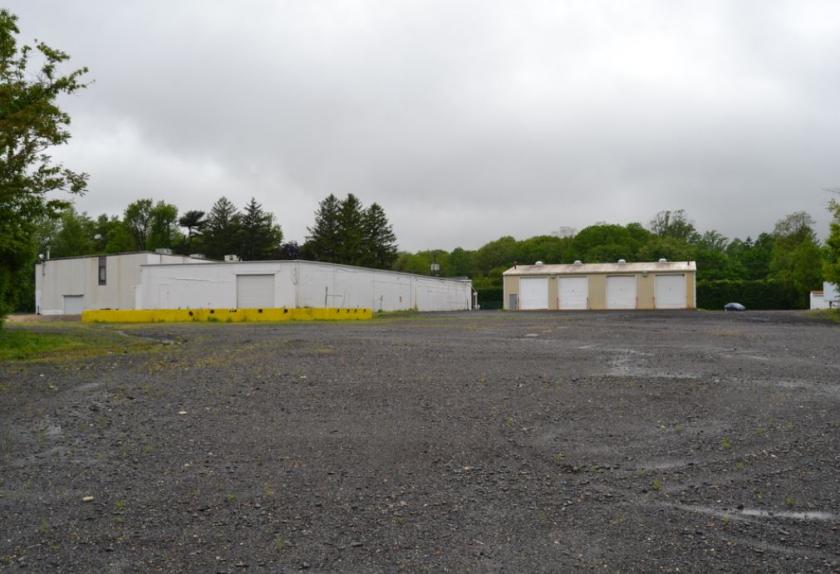
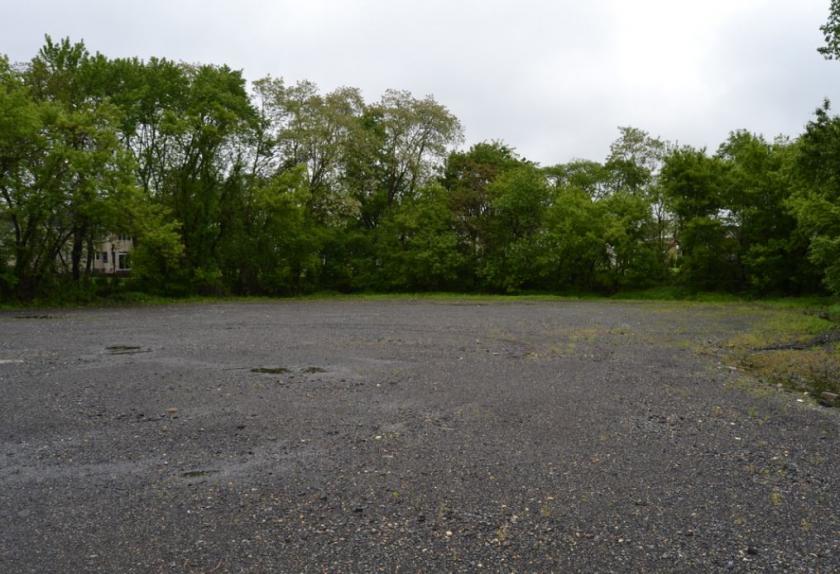
- • 6 to 7 acres available for parking
- • Property is fenced and gated
Additional Photos
Listing Agents

Mark Krupnick
KW Commercial
O: 732-617-4820
M: 732-691-5653
mkrupnick@kw.com
KW Commercial
O: 732-617-4820
M: 732-691-5653
mkrupnick@kw.com
While we strive to provide the most accurate information, all listing information, and demographic data, is provided by third-parties. As such, MyEListing will not be responsible for the accuracy of the information. It is strongly recommended that you verify all information with the listing agent, and any relevant agencies, prior to making any decisions.


