Office Space
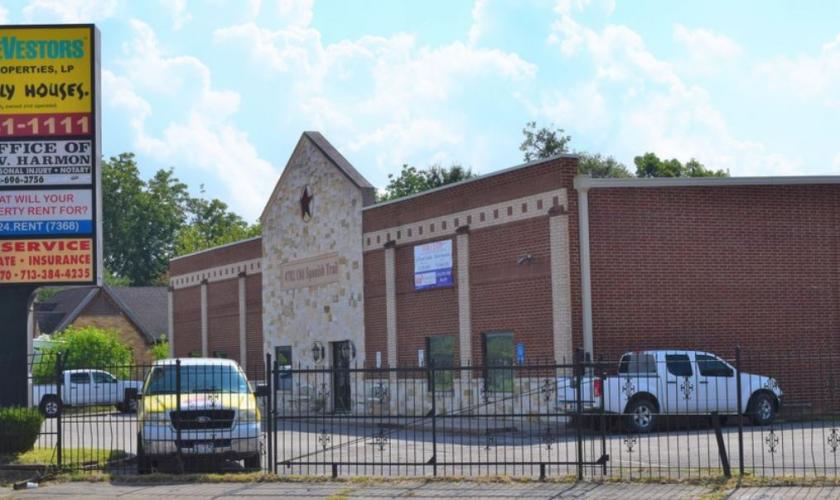
4702 Old Spanish Trail Houston, TX 77021
4702 Old Spanish Trail Houston, TX 77021

Details & Description
Property Highlights
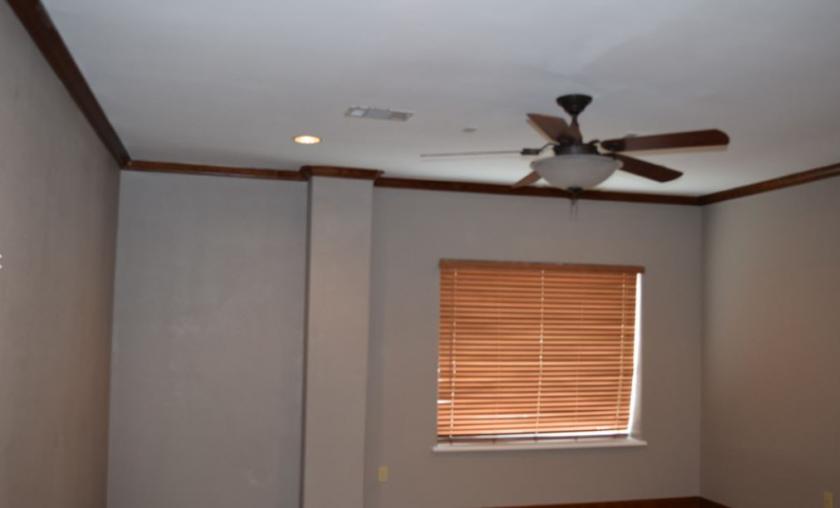
• 6,600 sf of office space private, open and conference area
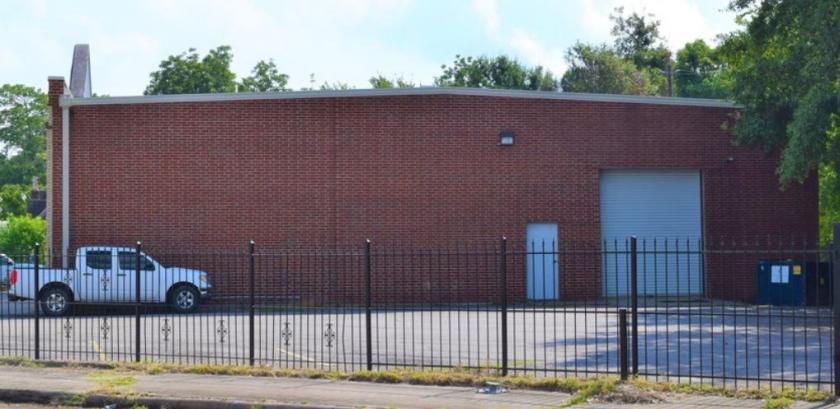
• Building can be used for single or multi-tenant users.
Additional Photos
Listing Agents

Wayne Landin
O: 713-470-2055
M: 713-202-3604
kwayne@kwcommercial.com
O: 713-470-2055
M: 713-202-3604
kwayne@kwcommercial.com
While we strive to provide the most accurate information, all listing information, and demographic data, is provided by third-parties. As such, MyEListing will not be responsible for the accuracy of the information. It is strongly recommended that you verify all information with the listing agent, and any relevant agencies, prior to making any decisions.


