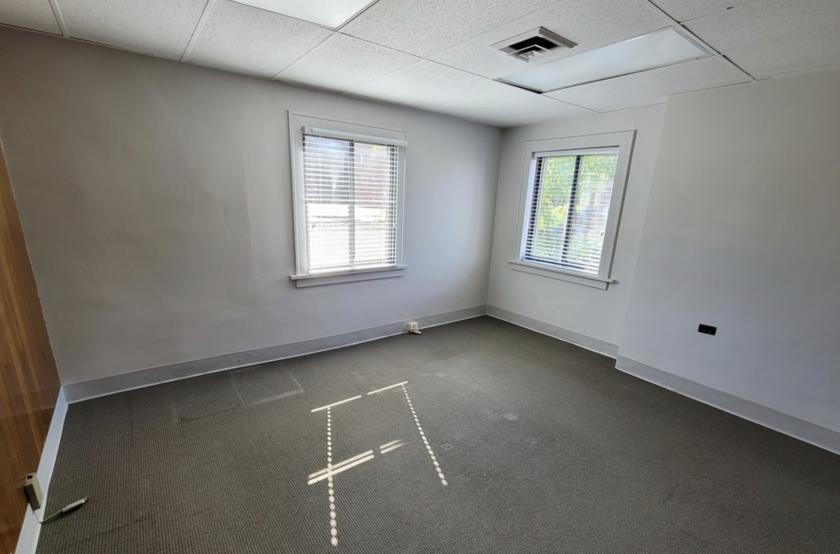
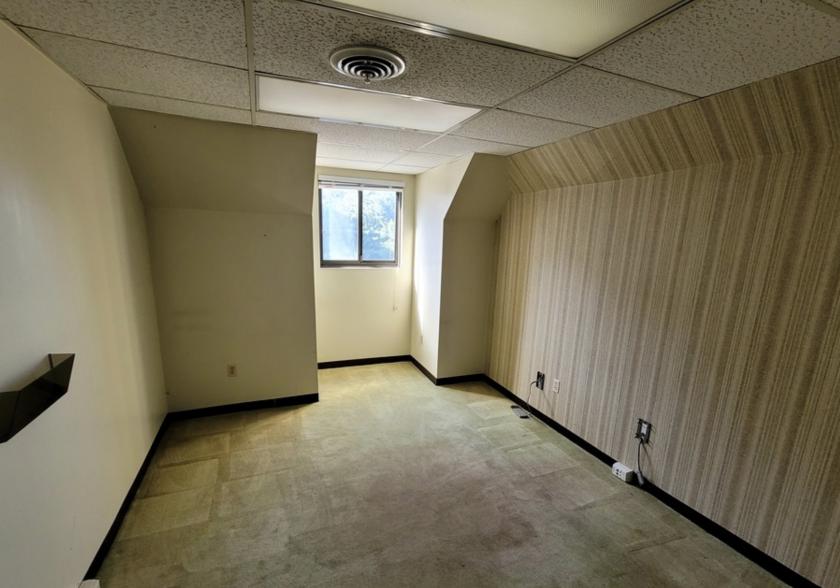
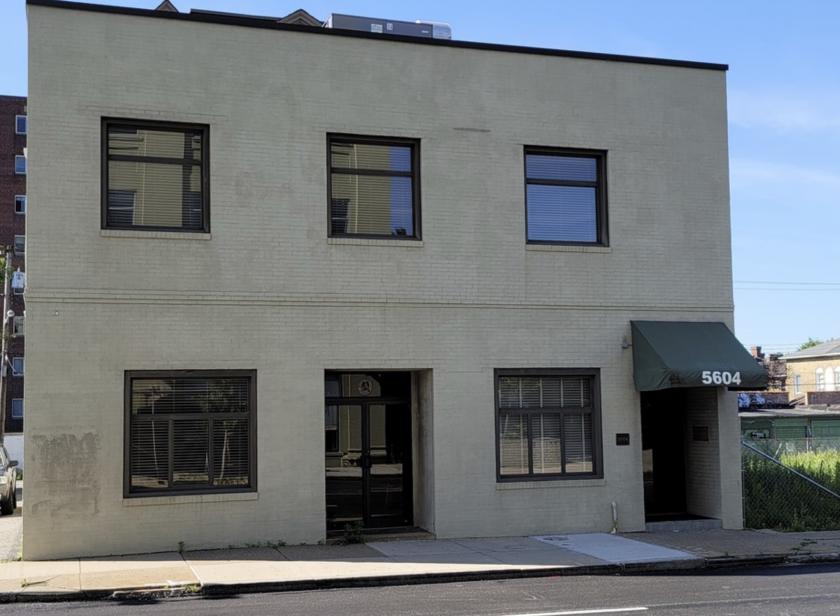
1-Mile | 3-Miles | 5-Miles | ||
---|---|---|---|---|
Total Population | 38,538 | 183,159 | 347,961 | |
Population Median Age | 36 | 38 | 39 | |
Population by Age | 0-9 Yrs | 2069 (5%) | 14002 (7%) | 30056 (8%) |
10-19 Yrs | 3202 (8%) | 20899 (11%) | 38991 (11%) | |
20-29 Yrs | 14747 (38%) | 49312 (26%) | 78119 (22%) | |
30-39 Yrs | 6650 (17%) | 28200 (15%) | 52189 (14%) | |
40-49 Yrs | 2487 (6%) | 15357 (8%) | 32364 (9%) | |
50-59 Yrs | 2844 (7%) | 17799 (9%) | 39828 (11%) | |
60-69 Yrs | 3314 (8%) | 18904 (10%) | 40061 (11%) | |
70+ Yrs | 3226 (8%) | 18685 (10%) | 36353 (10%) | |
Median HH Income | $47,305 | $48,391 | $48,916 | |
Total Household Income | < 24K | 6224 (30%) | 25667 (29%) | 46810 (28%) |
25-49K | 4458 (21%) | 18080 (21%) | 35285 (21%) | |
50-74K | 3070 (14%) | 12203 (14%) | 24929 (15%) | |
75-99K | 2341 (11%) | 8996 (10%) | 17189 (10%) | |
100-199K | 2963 (14%) | 14415 (16%) | 27629 (17%) | |
200K+ | 1466 (7%) | 6335 (7%) | 9919 (6%) | |
Highest Education Level | No Diploma | 953 | 7264 | 15314 |
Diploma or GED | 3501 | 24916 | 59656 | |
Some College | 2528 | 15696 | 36801 | |
Assoc. Degree | 1289 | 8052 | 18878 | |
Bachelors Degree | 8382 | 32086 | 56323 | |
Higher Degree | 9925 | 35320 | 53935 | |
Total Housing Units | 22,434 | 96,812 | 185,718 | |
--Owner-Occupied | 5,903 | 35,544 | 75,857 | |
--Renter-Occupied | 14,620 | 50,153 | 85,903 | |
Owner-Occupied Values | < 100K | 903 | 9535 | 27053 |
100-199K | 1375 | 9497 | 22999 | |
200-299K | 1206 | 6480 | 11379 | |
300-399K | 727 | 3758 | 5753 | |
400-499K | 483 | 2352 | 3359 | |
500K+ | 1208 | 3922 | 5314 | |
Total Working Age Population | 35,464 | 161,836 | 301,226 | |
In Work Force | 23,746 | 102,391 | 192,286 | |
Not In Work Force | 11,717 | 59,445 | 108,940 | |
Workforce Employed | 22,870 | 97,180 | 181,672 | |
Workforce Unemployed | 876 | 5,100 | 10,461 | |
Civlian Workforce | 23,746 | 102,280 | 192,133 | |
Military Workforce | 1 | 111 | 153 | |
Total Households | 20,523 | 85,696 | 161,760 | |
Family Households | 5,688 | 33,417 | 69,178 | |
Non-Family Households | 14,835 | 52,280 | 92,582 | |
Married Couple | 4,237 | 22,486 | 44,884 | |
Other Family | 1,451 | 10,930 | 24,294 | |
Married w/Child | 1,205 | 7,522 | 14,319 | |
Single Male w/Child | 49 | 962 | 2,192 | |
Single Female w/Child | 569 | 3,737 | 9,414 |
Population Change Last Two Decades - Plus Projection
2000 | % | 2010 | % | 2020 | % | 2030 | |
---|---|---|---|---|---|---|---|
Pennsylvania | 12,281,054 | +3 | 12,702,379 | +4 | 13,230,170 | +4 | 13,759,594 |
Allegheny County | 1,281,666 | -5 | 1,223,348 | +3 | 1,265,919 | +3 | 1,307,654 |
Washington County | 202,897 | +2 | 207,820 | 0 | 206,942 | 0 | 207,065 |
Westmoreland County | 369,993 | -1 | 365,169 | -2 | 358,574 | -1 | 354,298 |
Total Working Age Population:
Total Households:
Total Working Age Population:
Total Households:
Total Working Age Population:
Total Households: