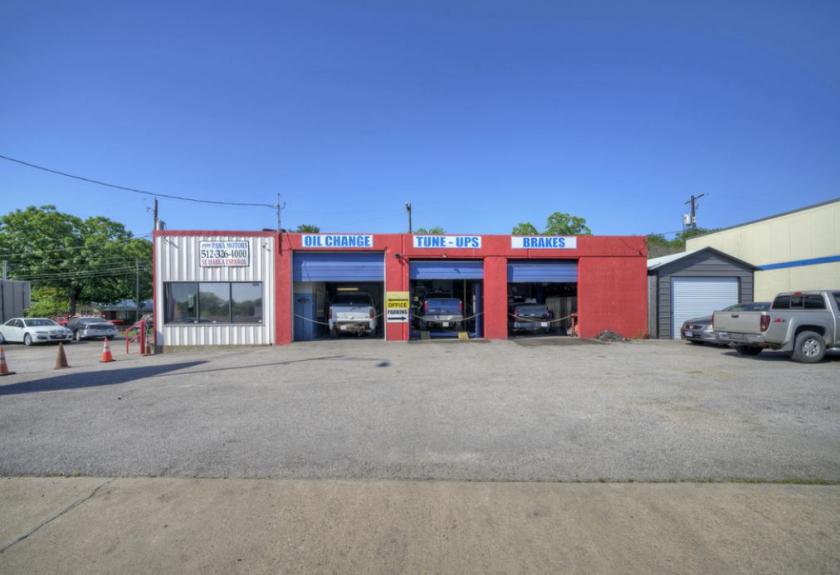
Retail Space
439 West Ben White Boulevard Austin, TX 78704
439 West Ben White Boulevard Austin, TX 78704
Details & Description
Property Highlights
- • Great visibility and access from Hwy 71 EastWest.
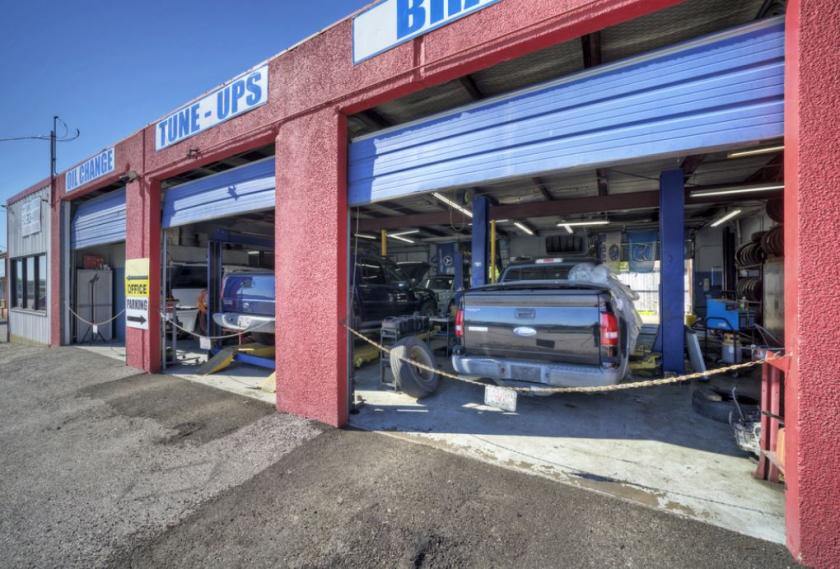
- • All tools and Client List for Sale
- • Appointment with Agent Required
Additional Photos


Listing Agents

Kristina Hayes
O: 512-346-3550
M: 512-590-2039
kristina@khcre.com
O: 512-346-3550
M: 512-590-2039
kristina@khcre.com
While we strive to provide the most accurate information, all listing information, and demographic data, is provided by third-parties. As such, MyEListing will not be responsible for the accuracy of the information. It is strongly recommended that you verify all information with the listing agent, and any relevant agencies, prior to making any decisions.


