Commercial Land
5220 130th Street Lubbock, TX 79424
5220 130th Street Lubbock, TX 79424
Details & Description
Property Highlights
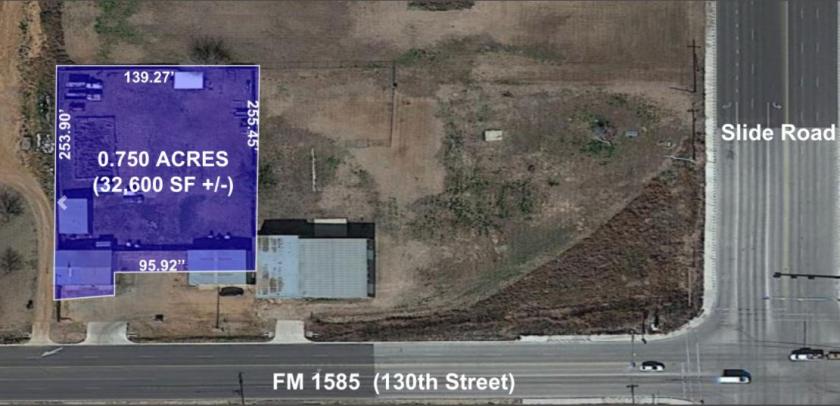
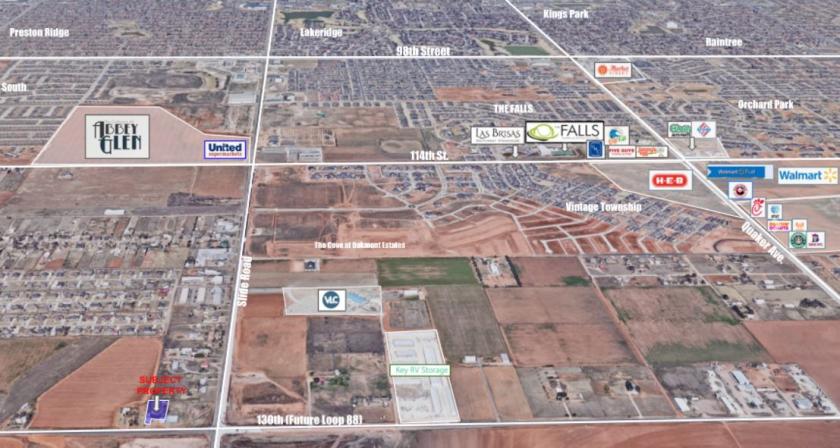
- • Slide Frontage
- • Cooper School District
- • Transitional Zoning
- • Frontage on FM 1585 Future Loop 88
Listing Agents

Kent Hebison
O: 806-340-7452
M: 806-577-3811
kent.hebison@kw.com
O: 806-340-7452
M: 806-577-3811
kent.hebison@kw.com
While we strive to provide the most accurate information, all listing information, and demographic data, is provided by third-parties. As such, MyEListing will not be responsible for the accuracy of the information. It is strongly recommended that you verify all information with the listing agent, and any relevant agencies, prior to making any decisions.