Industrial Properties
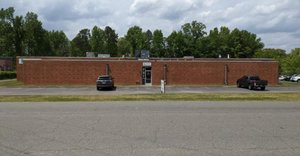
500 Hovis Road Stanley, NC 28164
500 Hovis Road Stanley, NC 28164

Details & Description
Property Highlights
- • Space features 9,768 s.f. of basement
- • 5 - 6 concrete floors
- • 125 deep asphalt truck court
- • 2,400 s.f. of service garage
- • 10 floors in the basement
Listing Agents

Matthew Hagler
O: 704-408-8867
mhagler@kwcommercial.com
O: 704-408-8867
mhagler@kwcommercial.com
While we strive to provide the most accurate information, all listing information, and demographic data, is provided by third-parties. As such, MyEListing will not be responsible for the accuracy of the information. It is strongly recommended that you verify all information with the listing agent, and any relevant agencies, prior to making any decisions.