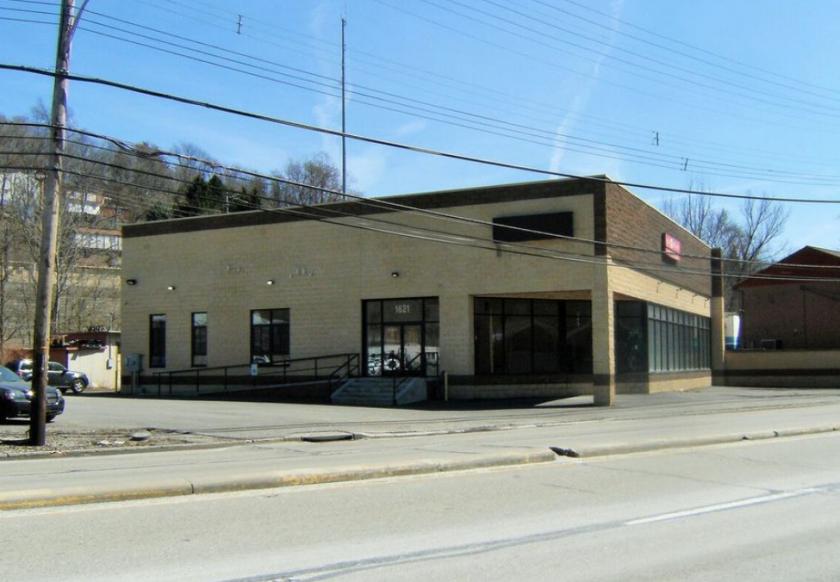
Retail Space
1621 Saw Mill Run Boulevard Pittsburgh, PA 15210
1621 Saw Mill Run Boulevard Pittsburgh, PA 15210
Details & Description
Property Highlights
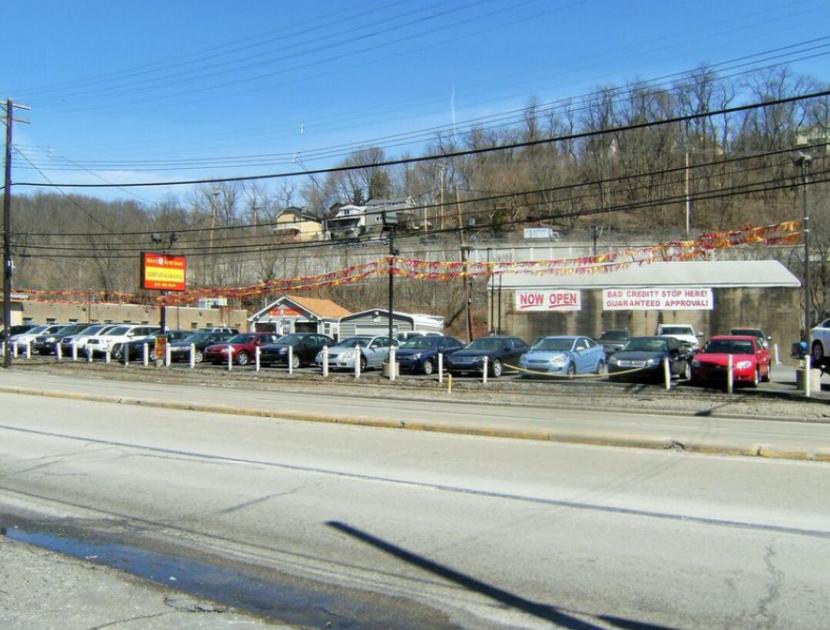
- • On site parking for 95 cars
- • State-of- the-art-Camera Security System
- • 289 Ft of Frontage
- • Close to everything
Additional Photos


Listing Agents

Bill Forde
KW Commercial
O: 412-854-4000
M: 412-439-0429
bforde@kwcommercial.com
KW Commercial
O: 412-854-4000
M: 412-439-0429
bforde@kwcommercial.com
While we strive to provide the most accurate information, all listing information, and demographic data, is provided by third-parties. As such, MyEListing will not be responsible for the accuracy of the information. It is strongly recommended that you verify all information with the listing agent, and any relevant agencies, prior to making any decisions.


