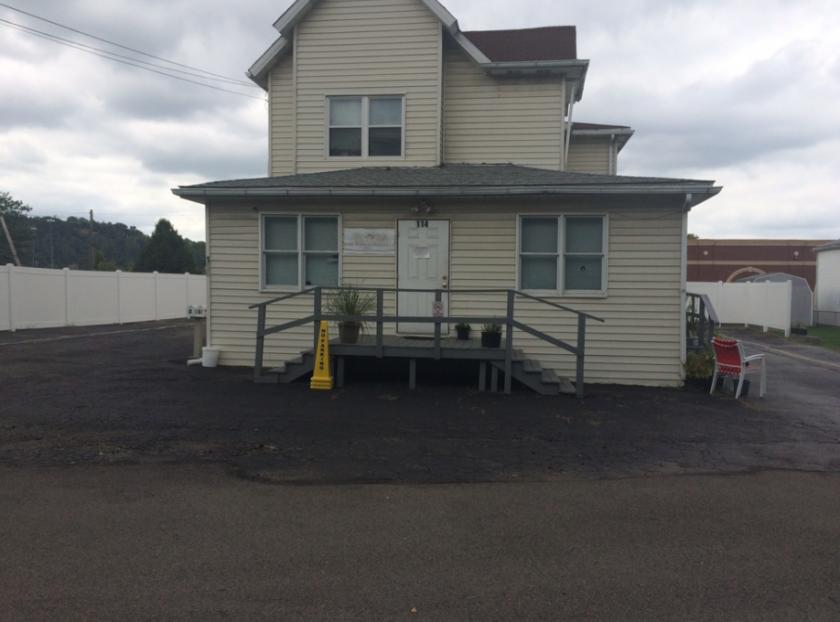
Office Space
114 Werner Street Bridgeville, PA 15017
114 Werner Street Bridgeville, PA 15017
Details & Description
Property Highlights
- • Fully leased property
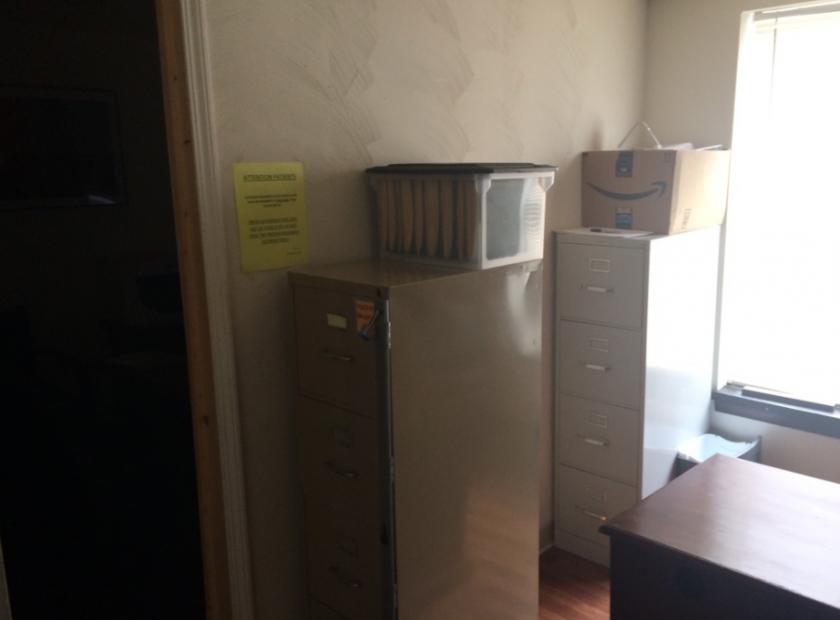
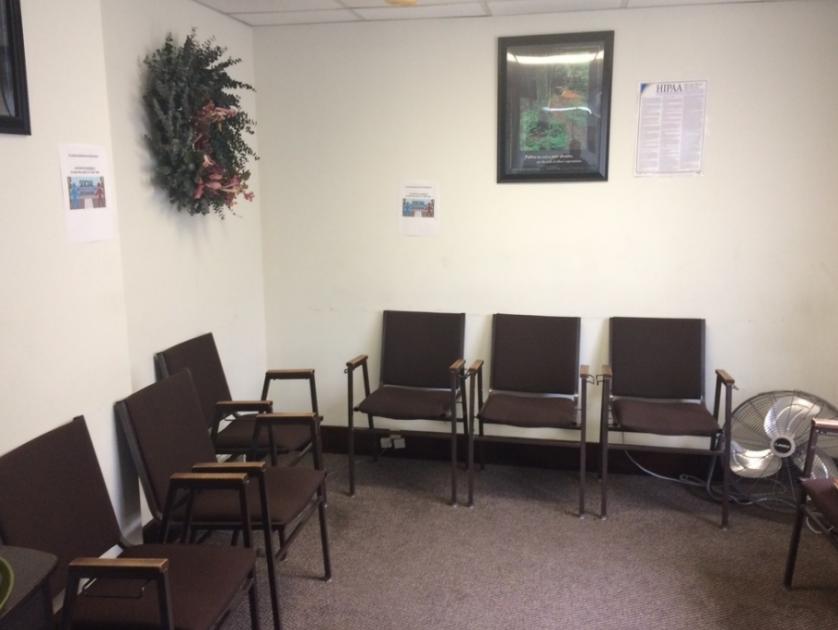
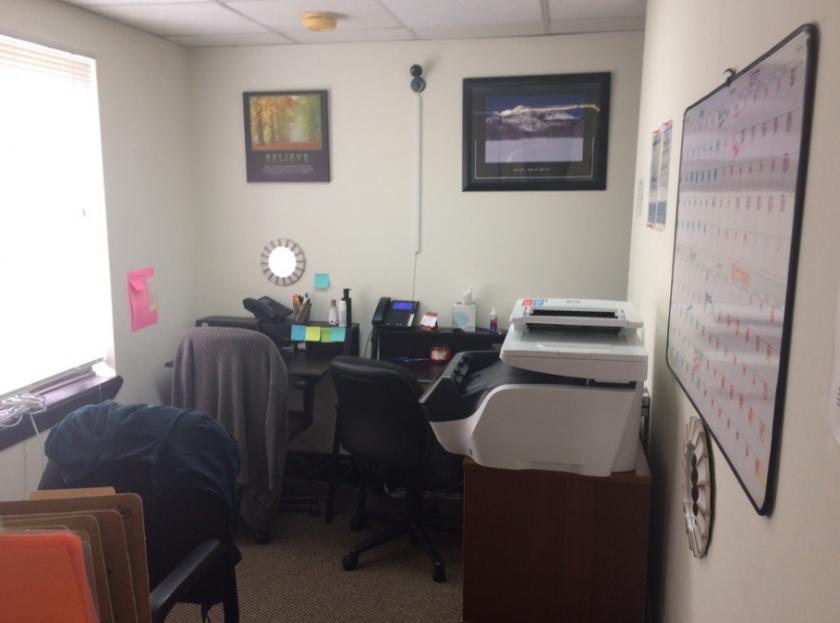
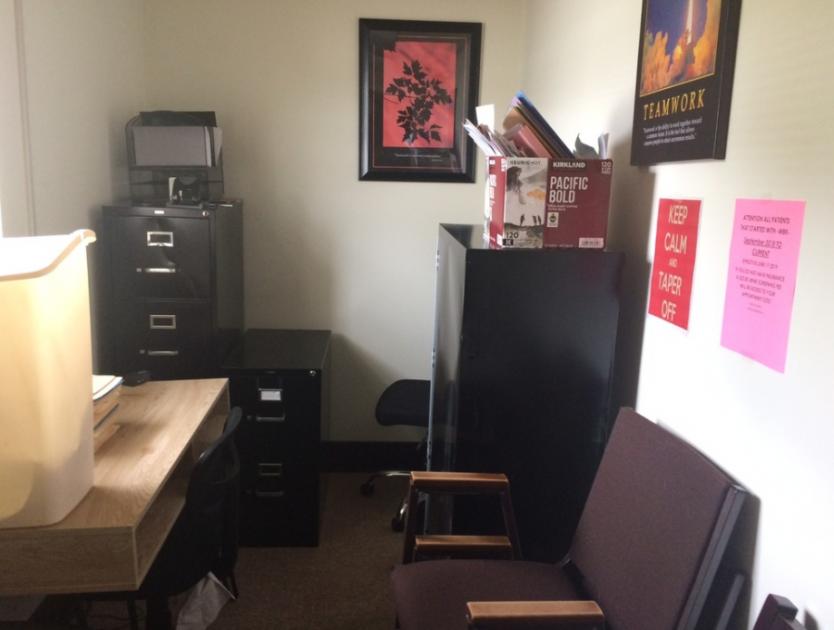
- • Interior spaces are in excellent condition
- • New Roof in February 2021
- • Great location close to Rt. 50 and I-79
Additional Photos
Listing Agents

Bill Forde
KW Commercial
O: 412-854-4000
M: 412-439-0429
bforde@kwcommercial.com
KW Commercial
O: 412-854-4000
M: 412-439-0429
bforde@kwcommercial.com
While we strive to provide the most accurate information, all listing information, and demographic data, is provided by third-parties. As such, MyEListing will not be responsible for the accuracy of the information. It is strongly recommended that you verify all information with the listing agent, and any relevant agencies, prior to making any decisions.


