Specialty Real Estate
32 4th Avenue North Casselton, ND 58012
32 4th Avenue North Casselton, ND 58012

Details & Description
Property Highlights
- • Great Location
- • Value Add Opportunity
- • Minimal Owner Expenses
- • Close to FargoMoorhead
- • Separately Metered
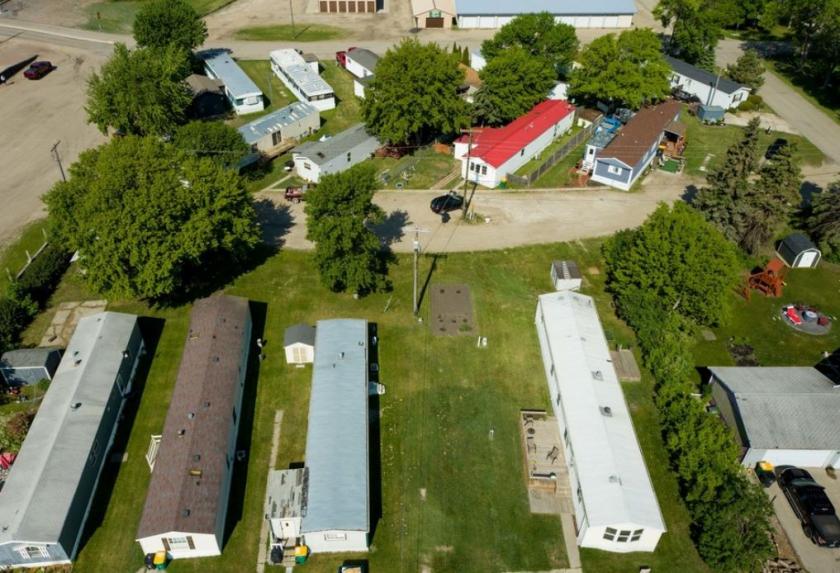
Additional Photos


Listing Agents

Jason Harmon
O: 701-491-9010
M: 701-306-2019
jasonharmon@kw.com
O: 701-491-9010
M: 701-306-2019
jasonharmon@kw.com
While we strive to provide the most accurate information, all listing information, and demographic data, is provided by third-parties. As such, MyEListing will not be responsible for the accuracy of the information. It is strongly recommended that you verify all information with the listing agent, and any relevant agencies, prior to making any decisions.


