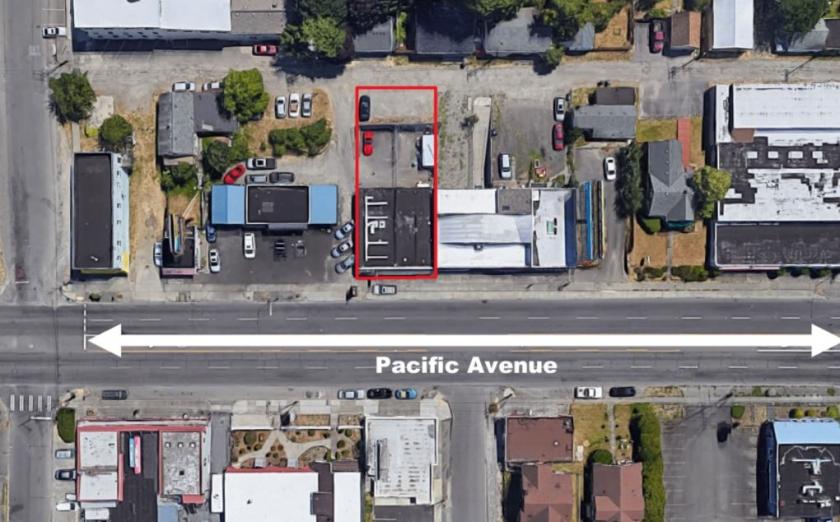
1-Mile | 3-Miles | 5-Miles | ||
---|---|---|---|---|
Total Population | 20,614 | 114,476 | 268,187 | |
Population Median Age | 35 | 36 | 36 | |
Population by Age | 0-9 Yrs | 3510 (17%) | 15928 (13%) | 36089 (13%) |
10-19 Yrs | 2141 (10%) | 13531 (11%) | 31489 (11%) | |
20-29 Yrs | 3699 (17%) | 19218 (16%) | 47024 (17%) | |
30-39 Yrs | 3178 (15%) | 18838 (16%) | 42025 (15%) | |
40-49 Yrs | 2395 (11%) | 14703 (12%) | 33023 (12%) | |
50-59 Yrs | 2535 (12%) | 13848 (12%) | 32553 (12%) | |
60-69 Yrs | 1786 (8%) | 10231 (8%) | 25194 (9%) | |
70+ Yrs | 1370 (6%) | 8179 (7%) | 20790 (7%) | |
Median HH Income | $63,036 | $54,771 | $58,385 | |
Total Household Income | < 24K | 1055 (14%) | 9186 (21%) | 20336 (19%) |
25-49K | 1554 (21%) | 10075 (23%) | 23845 (23%) | |
50-74K | 1735 (24%) | 8916 (21%) | 20072 (19%) | |
75-99K | 1184 (16%) | 5789 (13%) | 14180 (13%) | |
100-199K | 1483 (20%) | 7263 (17%) | 20818 (20%) | |
200K+ | 209 (2%) | 1119 (2%) | 4059 (3%) | |
Highest Education Level | No Diploma | 1495 | 12171 | 21885 |
Diploma or GED | 4188 | 21978 | 49062 | |
Some College | 3572 | 19729 | 44177 | |
Assoc. Degree | 1227 | 7139 | 17285 | |
Bachelors Degree | 2116 | 11278 | 31033 | |
Higher Degree | 1092 | 4371 | 15731 | |
Total Housing Units | 7,707 | 45,749 | 111,617 | |
--Owner-Occupied | 4,907 | 21,587 | 50,969 | |
--Renter-Occupied | 2,313 | 20,762 | 52,341 | |
Owner-Occupied Values | < 100K | 240 | 1340 | 2990 |
100-199K | 1721 | 7597 | 11862 | |
200-299K | 2047 | 8212 | 16876 | |
300-399K | 755 | 3454 | 10272 | |
400-499K | 106 | 519 | 4285 | |
500K+ | 39 | 464 | 4684 | |
Total Working Age Population | 15,598 | 90,205 | 213,463 | |
In Work Force | 10,775 | 58,216 | 139,931 | |
Not In Work Force | 4,823 | 31,989 | 73,532 | |
Workforce Employed | 10,069 | 54,172 | 129,840 | |
Workforce Unemployed | 575 | 3,176 | 7,362 | |
Civlian Workforce | 10,644 | 57,348 | 137,202 | |
Military Workforce | 131 | 868 | 2,729 | |
Total Households | 7,220 | 42,349 | 103,310 | |
Family Households | 4,660 | 24,732 | 60,130 | |
Non-Family Households | 2,560 | 17,617 | 43,180 | |
Married Couple | 2,976 | 15,834 | 40,921 | |
Other Family | 1,684 | 8,898 | 19,209 | |
Married w/Child | 1,306 | 6,837 | 17,508 | |
Single Male w/Child | 349 | 1,180 | 2,879 | |
Single Female w/Child | 533 | 3,493 | 7,785 |
Population Change Last Two Decades - Plus Projection
2000 | % | 2010 | % | 2020 | % | 2030 | |
---|---|---|---|---|---|---|---|
Washington | 5,894,121 | +14 | 6,724,540 | +14 | 7,638,415 | +11 | 8,503,178 |
King County | 1,737,034 | +11 | 1,931,249 | +16 | 2,231,408 | +11 | 2,474,625 |
Pierce County | 700,820 | +13 | 795,225 | +13 | 901,251 | +11 | 1,002,412 |
Thurston County | 207,355 | +22 | 252,264 | +17 | 294,333 | +14 | 335,965 |
Total Working Age Population:
Total Households:
Total Working Age Population:
Total Households:
Total Working Age Population:
Total Households: