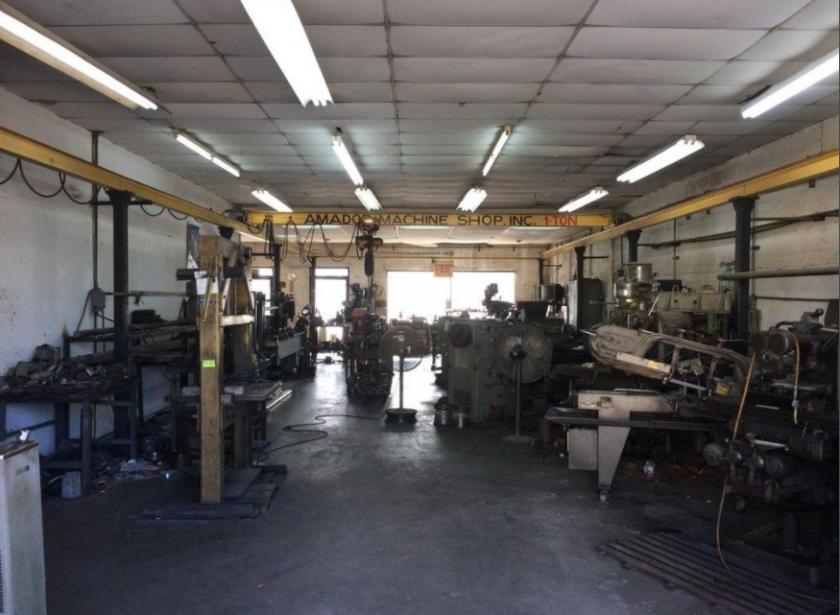
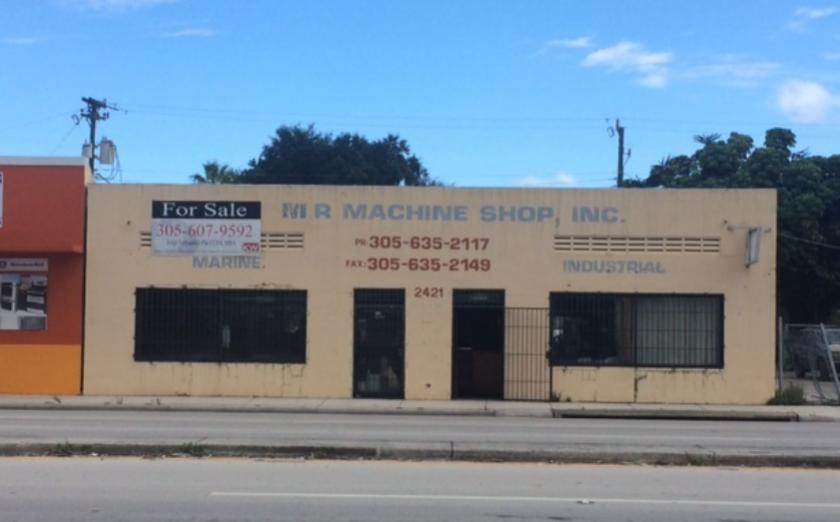
Retail Space
2421 Northwest 27th Avenue Miami, FL 33142
2421 Northwest 27th Avenue Miami, FL 33142
Details & Description
Property Highlights
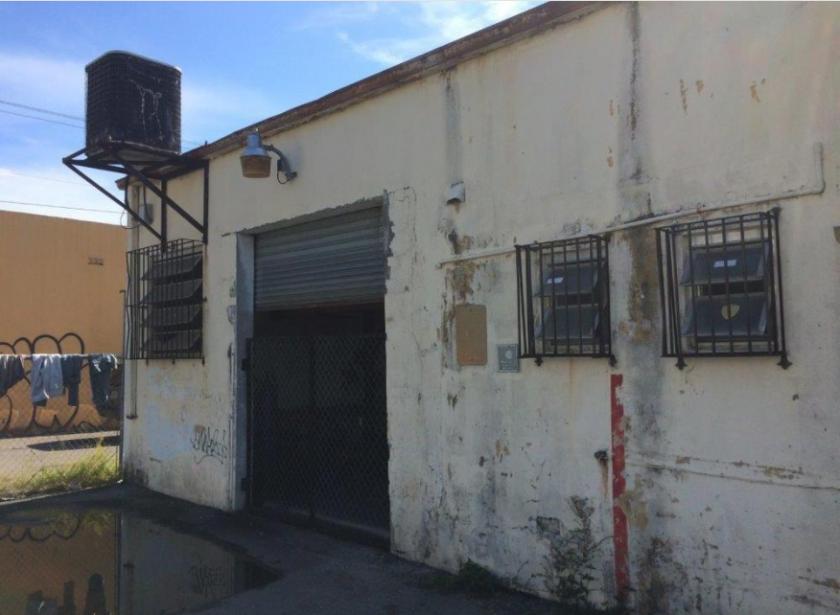
- • New Roof
- • Large office 100200sf
- • Parking in rear
- • Two bay doors
- • 2 bathrooms
Listing Agents

Jorge Fernandez
KW Commercial
O: 305-549-5122
info@icmgroup.us
KW Commercial
O: 305-549-5122
info@icmgroup.us
While we strive to provide the most accurate information, all listing information, and demographic data, is provided by third-parties. As such, MyEListing will not be responsible for the accuracy of the information. It is strongly recommended that you verify all information with the listing agent, and any relevant agencies, prior to making any decisions.