Flex-Office-Warehouse
193 Lowes Drive Pittsboro, NC 27312
193 Lowes Drive Pittsboro, NC 27312

Details & Description
Property Highlights
- • Building is Shadow-Anchored to Lowes
- • Lease from 1,550 SF to 8,100 SF
- • Flexible Floorplan Options
- • Ideal for Office or Warehouse Use
- • Close to Shopping and Dining
- • Corner Unit Available
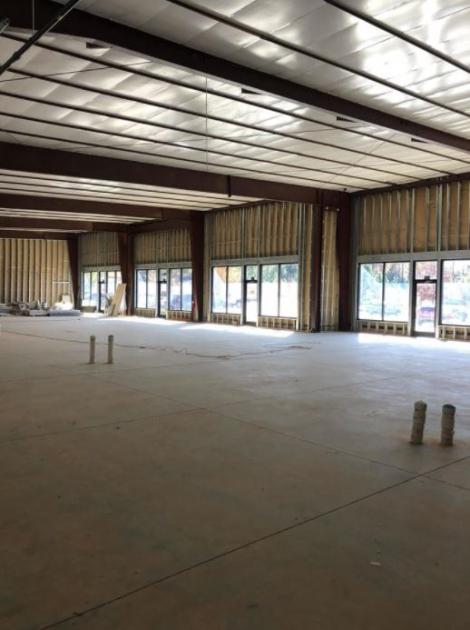
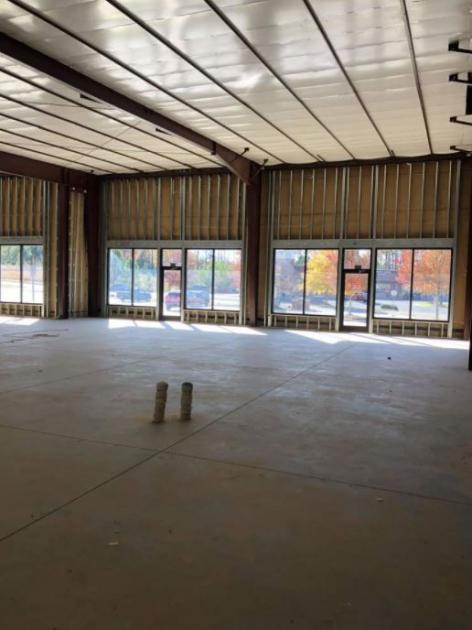
Additional Photos

Listing Agents

Vandan Gandhi
KW Commercial
O: 919-475-5769
van.kwcommercial@gmail.com
KW Commercial
O: 919-475-5769
van.kwcommercial@gmail.com
While we strive to provide the most accurate information, all listing information, and demographic data, is provided by third-parties. As such, MyEListing will not be responsible for the accuracy of the information. It is strongly recommended that you verify all information with the listing agent, and any relevant agencies, prior to making any decisions.


