Specialty Real Estate
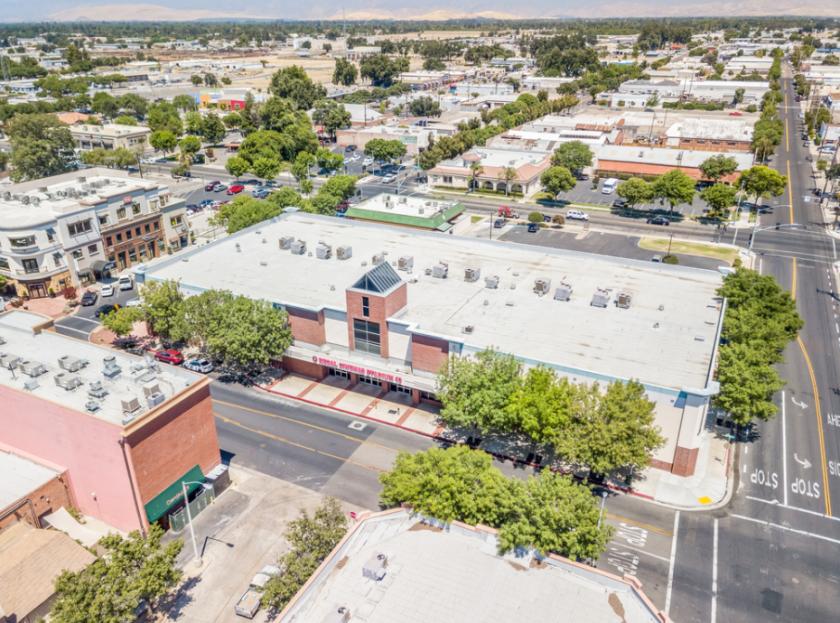
120 South Bridge Street Visalia, CA 93291
120 South Bridge Street Visalia, CA 93291
Details & Description
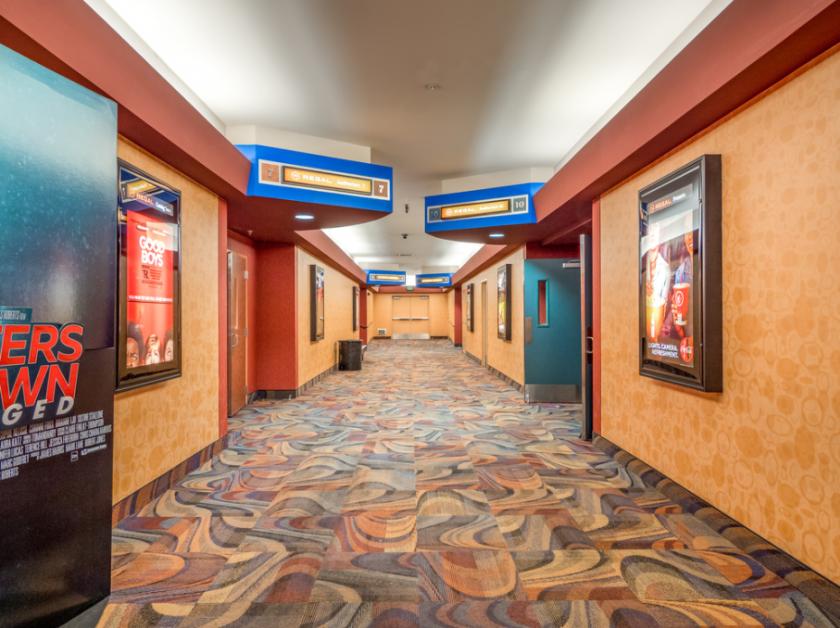
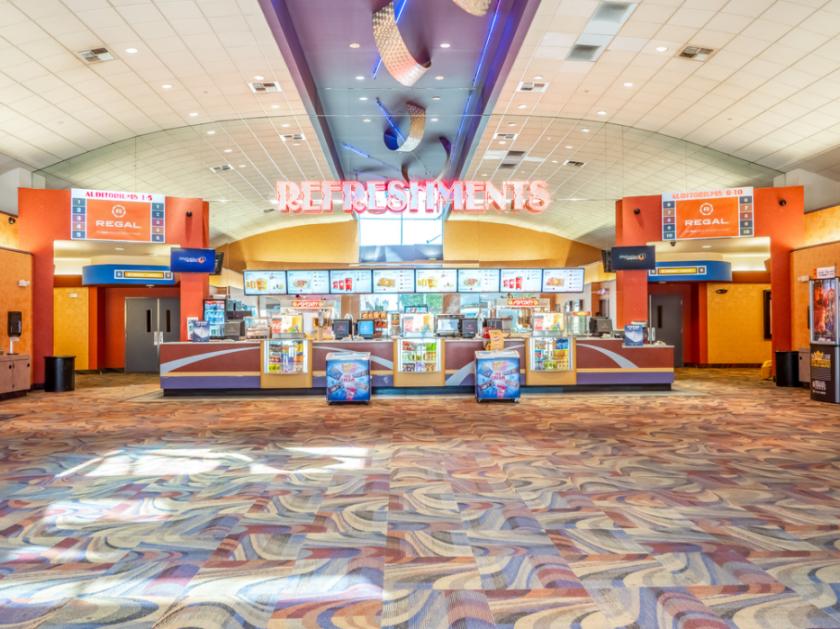
Additional Photos

Listing Agents

Jared Ennis
O: 559-705-1000
M: 559-705-1000
jared@centralcacommercial.com
O: 559-705-1000
M: 559-705-1000
jared@centralcacommercial.com

Kevin Land
KW Commercial
O: 559-705-1000
M: 559-359-4035
kevin@centralcacommercial.com
KW Commercial
O: 559-705-1000
M: 559-359-4035
kevin@centralcacommercial.com
While we strive to provide the most accurate information, all listing information, and demographic data, is provided by third-parties. As such, MyEListing will not be responsible for the accuracy of the information. It is strongly recommended that you verify all information with the listing agent, and any relevant agencies, prior to making any decisions.


