Commercial Land
24520 Jefferson Avenue Murrieta, CA 92562
24520 Jefferson Avenue Murrieta, CA 92562
Details & Description
Property Highlights
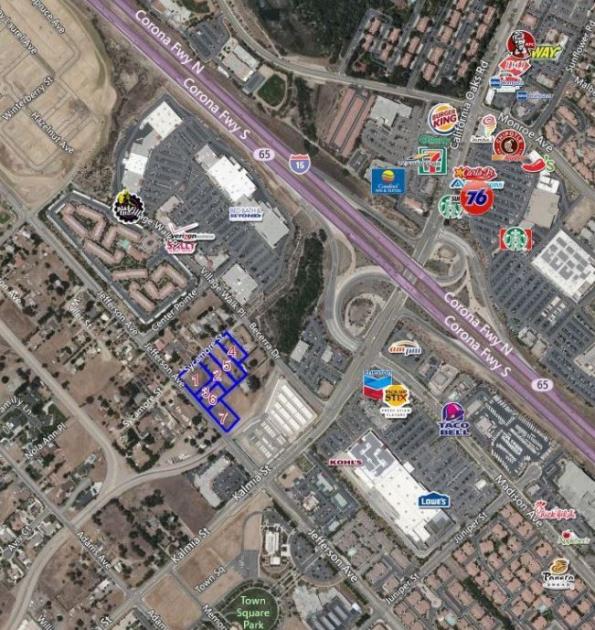
• Suitable use school, senior housing, lodging, ware house, and medical office
• Within freeway visibility of the 15 Freeway exit California Oaks Kalmia
Listing Agents
Michael Fukushima
KW Commercial
O: 818-321-6490
mfukushima@total-realtygroup.com
KW Commercial
O: 818-321-6490
mfukushima@total-realtygroup.com
While we strive to provide the most accurate information, all listing information, and demographic data, is provided by third-parties. As such, MyEListing will not be responsible for the accuracy of the information. It is strongly recommended that you verify all information with the listing agent, and any relevant agencies, prior to making any decisions.