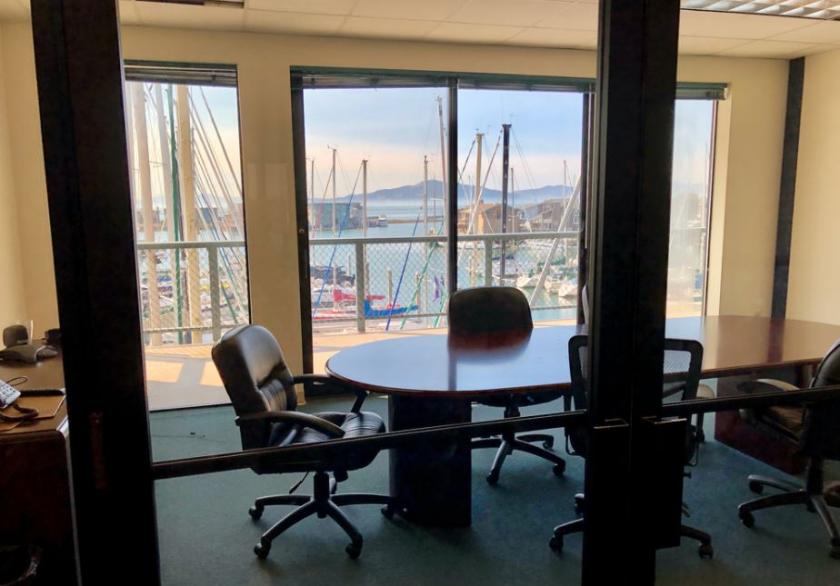
Office Space
1230 Brickyard Cove Road Richmond, CA 94801
1230 Brickyard Cove Road Richmond, CA 94801

Details & Description
Property Highlights
- • Easy Access to Highway 580 I-80
- • 25 minutes from Oakland Airport
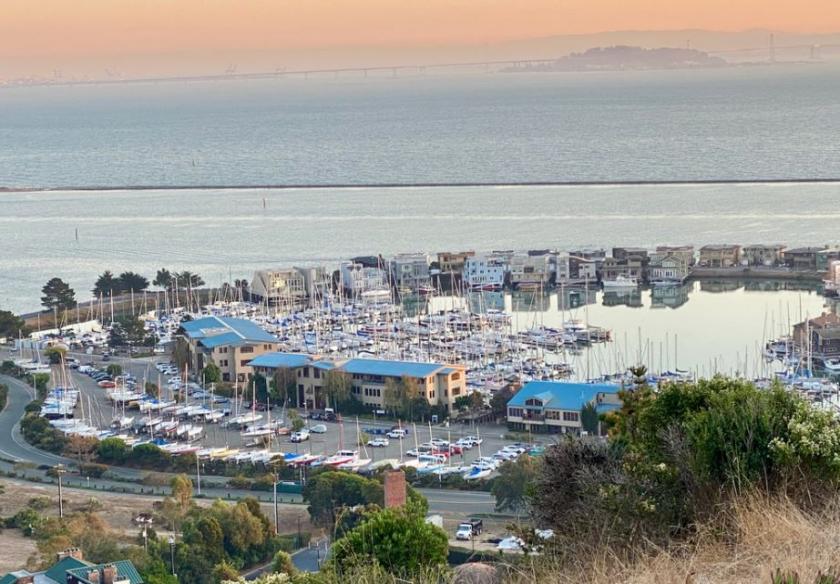
- • On the Bay Trail for Walking Biking Access
- • Boat Owners Delight Keep Your Boat Onsite
- • Wide Open Parking
Additional Photos

Listing Agents

Serena Fuchs
KW Commercial
O: 408-416-6469
serenafuchs@kw.com
KW Commercial
O: 408-416-6469
serenafuchs@kw.com
While we strive to provide the most accurate information, all listing information, and demographic data, is provided by third-parties. As such, MyEListing will not be responsible for the accuracy of the information. It is strongly recommended that you verify all information with the listing agent, and any relevant agencies, prior to making any decisions.


