Specialty Real Estate
820 Market Street Cheraw, SC 29520
820 Market Street Cheraw, SC 29520
Details & Description
Property Highlights
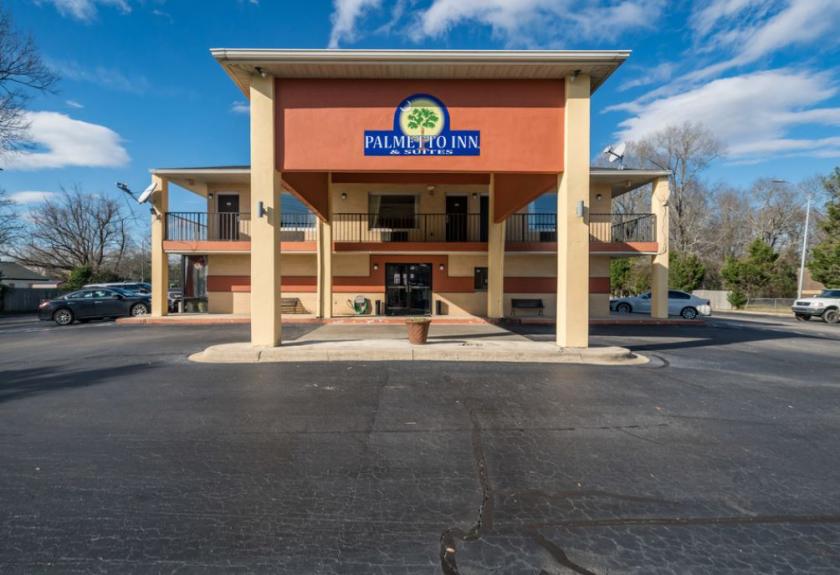
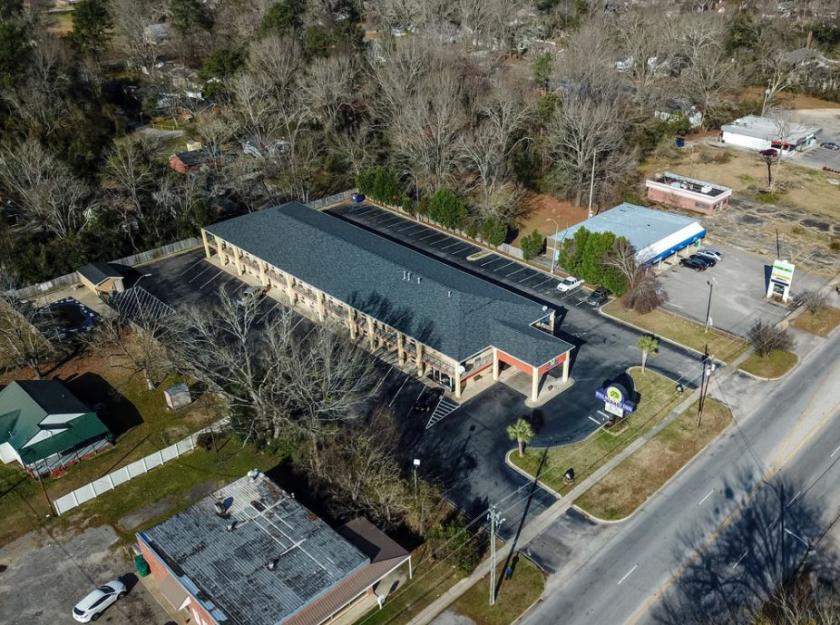
- • Previous Days inn
- • Ideal for Owner operator
- • Multiple Flags available
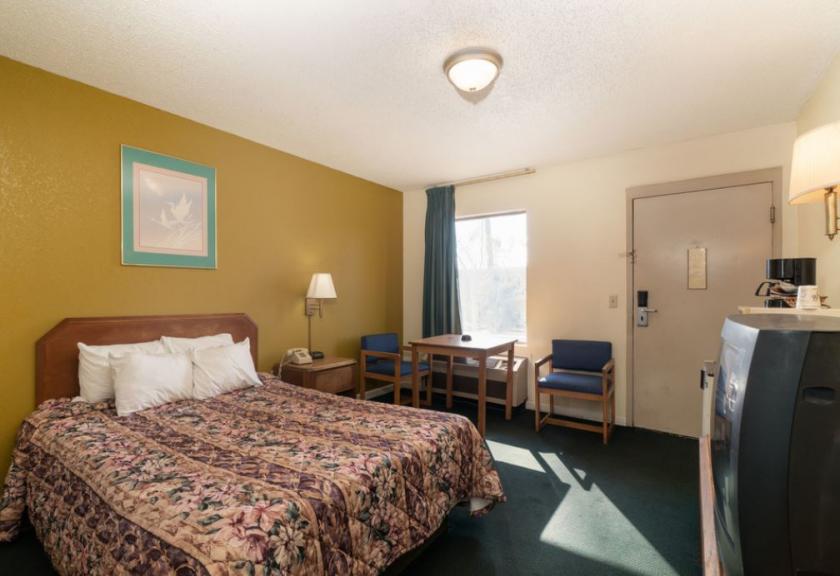
Additional Photos

Listing Agents

Justin Francis
O: 704-879-5571
jfrancis@kw.com
O: 704-879-5571
jfrancis@kw.com
While we strive to provide the most accurate information, all listing information, and demographic data, is provided by third-parties. As such, MyEListing will not be responsible for the accuracy of the information. It is strongly recommended that you verify all information with the listing agent, and any relevant agencies, prior to making any decisions.


