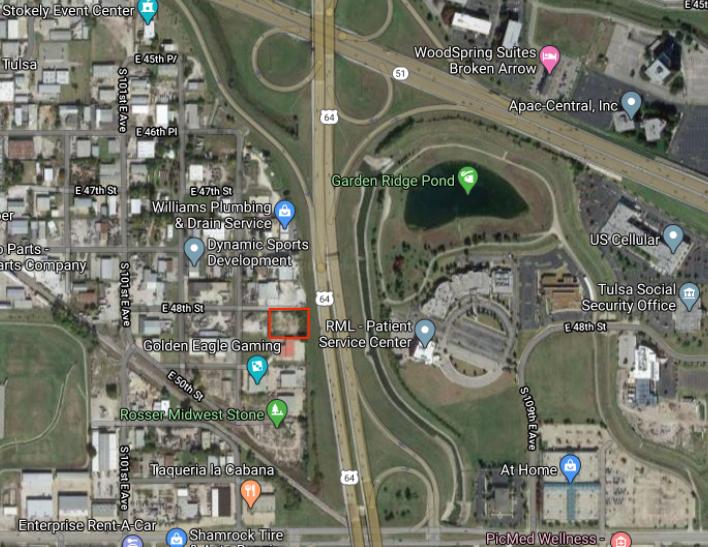
1-Mile | 3-Miles | 5-Miles | ||
---|---|---|---|---|
Total Population | 6,377 | 93,807 | 229,534 | |
Population Median Age | 32 | 35 | 37 | |
Population by Age | 0-9 Yrs | 1123 (17%) | 14104 (15%) | 31585 (13%) |
10-19 Yrs | 906 (14%) | 13584 (14%) | 30473 (13%) | |
20-29 Yrs | 1207 (18%) | 15474 (16%) | 35024 (15%) | |
30-39 Yrs | 1048 (16%) | 13068 (13%) | 31760 (13%) | |
40-49 Yrs | 751 (11%) | 10909 (11%) | 27279 (11%) | |
50-59 Yrs | 638 (10%) | 10438 (11%) | 27335 (11%) | |
60-69 Yrs | 385 (6%) | 8401 (8%) | 24096 (10%) | |
70+ Yrs | 319 (5%) | 7828 (8%) | 21982 (9%) | |
Median HH Income | $35,744 | $47,412 | $54,284 | |
Total Household Income | < 24K | 903 (35%) | 8534 (23%) | 18398 (20%) |
25-49K | 712 (28%) | 10439 (28%) | 24053 (26%) | |
50-74K | 457 (18%) | 7027 (19%) | 17693 (19%) | |
75-99K | 144 (5%) | 4143 (11%) | 11094 (12%) | |
100-199K | 239 (9%) | 5022 (13%) | 16030 (17%) | |
200K+ | 68 (2%) | 965 (2%) | 4217 (4%) | |
Highest Education Level | No Diploma | 655 | 8181 | 16355 |
Diploma or GED | 1375 | 16833 | 37541 | |
Some College | 876 | 14555 | 36682 | |
Assoc. Degree | 205 | 4789 | 13198 | |
Bachelors Degree | 471 | 10205 | 32760 | |
Higher Degree | 237 | 4297 | 14958 | |
Total Housing Units | 2,759 | 39,993 | 101,563 | |
--Owner-Occupied | 711 | 16,417 | 48,705 | |
--Renter-Occupied | 1,811 | 19,712 | 42,780 | |
Owner-Occupied Values | < 100K | 297 | 3974 | 10124 |
100-199K | 298 | 9798 | 25379 | |
200-299K | 85 | 1971 | 8524 | |
300-399K | 17 | 369 | 2736 | |
400-499K | 7 | 146 | 876 | |
500K+ | 7 | 158 | 1067 | |
Total Working Age Population | 4,679 | 71,200 | 178,735 | |
In Work Force | 3,420 | 49,123 | 122,628 | |
Not In Work Force | 1,260 | 22,077 | 56,106 | |
Workforce Employed | 3,217 | 46,110 | 115,846 | |
Workforce Unemployed | 202 | 2,941 | 6,638 | |
Civlian Workforce | 3,419 | 49,051 | 122,484 | |
Military Workforce | 0 | 72 | 145 | |
Total Households | 2,522 | 36,129 | 91,485 | |
Family Households | 1,426 | 22,190 | 55,788 | |
Non-Family Households | 1,096 | 13,939 | 35,697 | |
Married Couple | 767 | 14,060 | 38,918 | |
Other Family | 659 | 8,130 | 16,870 | |
Married w/Child | 446 | 6,034 | 15,903 | |
Single Male w/Child | 89 | 1,149 | 2,642 | |
Single Female w/Child | 308 | 3,682 | 6,933 |
Population Change Last Two Decades - Plus Projection
2000 | % | 2010 | % | 2020 | % | 2030 | |
---|---|---|---|---|---|---|---|
Oklahoma | 3,450,654 | +9 | 3,751,351 | +7 | 4,024,202 | +7 | 4,302,501 |
Rogers County | 70,641 | +23 | 86,905 | +14 | 98,672 | +14 | 112,208 |
Tulsa County | 563,299 | +7 | 603,403 | +8 | 652,183 | +8 | 703,461 |
Wagoner County | 57,491 | +27 | 73,085 | +14 | 83,139 | +14 | 94,385 |
Total Working Age Population:
Total Households:
Total Working Age Population:
Total Households:
Total Working Age Population:
Total Households: