Commercial Land
4831 Northwest 38th Avenue Camas, WA 98607
4831 Northwest 38th Avenue Camas, WA 98607
Details & Description
Property Highlights
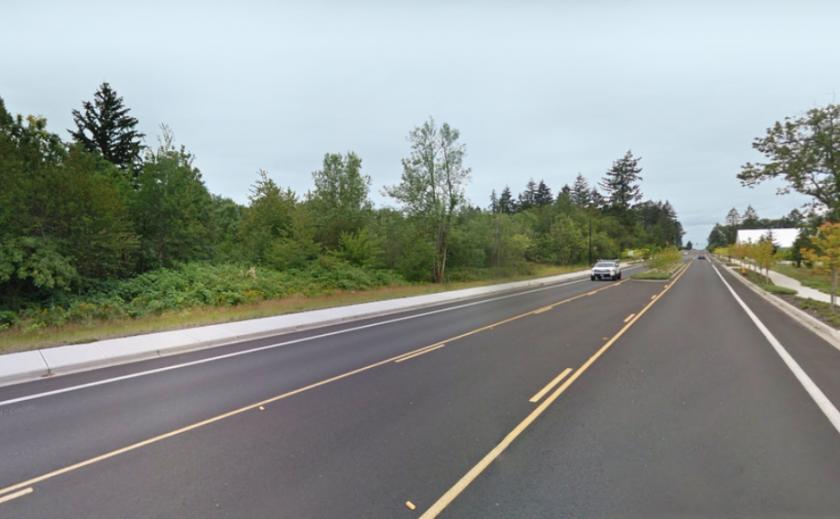
- • 13.55 Acres of level property
- • Excellent traffic counts
- • 530 of frontage on fully improved NW 38th Avenue
Listing Agents

Jim Farris
KW Commercial
O: 503-381-0771
M: 503-381-0771
farrisgroup@gmail.com
KW Commercial
O: 503-381-0771
M: 503-381-0771
farrisgroup@gmail.com
While we strive to provide the most accurate information, all listing information, and demographic data, is provided by third-parties. As such, MyEListing will not be responsible for the accuracy of the information. It is strongly recommended that you verify all information with the listing agent, and any relevant agencies, prior to making any decisions.